A new tool developed by researchers from The Australian National University (ANU) shows the best locations around Australia that could be used to install new wind or solar farms.
The ANU ‘heat maps’ project is aimed at farmers and landholders, who the researchers say are a crucial piece of the puzzle to help accelerate Australia’s solar and wind uptake and help the nation meet its renewable energy targets.
The researchers say between Goulburn to Lithgow in New South Wales is especially suitable for new clean energy sites because it is well serviced by transmission lines and has good wind and solar resources. Tasmania has plenty of potential for new wind farms along the north coast and on the King and Flinders islands.
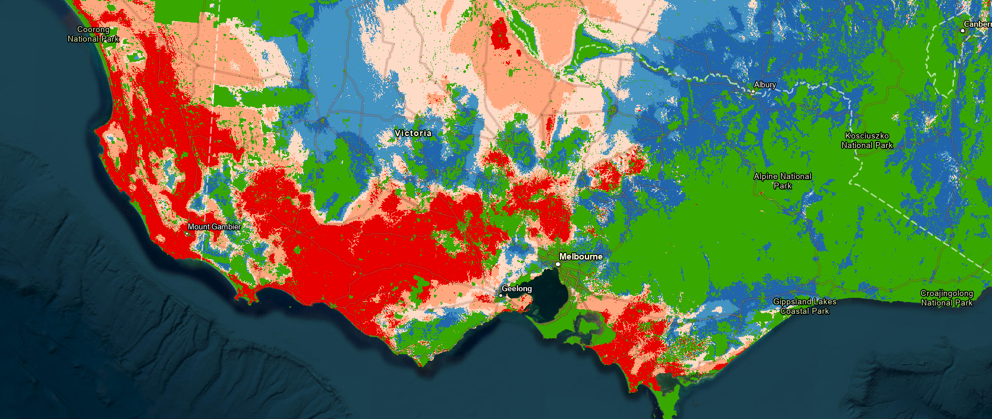
“In Victoria, the Yallourn district is attractive because of good wind potential and strong existing transmission into Melbourne, plus there’s a need to replace local coal industry jobs. There’s also extensive wind potential west of Melbourne,” Professor Andrew Blakers, from the ANU College of Engineering, Computing and Cybernetics, said. “Meantime South Australia has excellent wind and solar potential to the east of the St Vincent and Spencer gulfs, while Queensland’s best wind and solar sites follow the coastal transmission lines north from Brisbane in areas such as Rockhampton and Mackay.
“Perth, on the other hand, has an abundance of suitable solar and wind sites close to transmission lines that run from the north and the south of the city.”
ANU PhD researcher Cheng Cheng, who was also involved in the study, said the project aims to empower landowners to approach developers directly and negotiate with them to build solar or wind farms on their property.
“Access to high voltage transmission lines is essential for solar and wind farms and landholders in windy and sunny areas near existing infrastructure have a valuable economic opportunity,” he said.
“Our heat maps are designed to facilitate collective bargaining with developers. This can also assist the solar and wind farm developers by reducing the complexity and time required to gain legal access and community acceptance.
“If landowners or local councils are able to access this sort of information and collectively approach developers themselves, it could speed up the development process. Currently, developers approaching individual landowners may face high rejection rates.
“Landholders who host solar or wind farms have another drought-proof income source. This is beneficial for farmers, as crops can be grown underneath both solar and wind farms and animals can have access to shade.”
Professor Blakers said access to high power transmission lines is the biggest constraint currently facing developers.
“Typical power lines cross dozens to hundreds of properties and require complex negotiations with many people. In contrast, solar and wind farms generally fit on one or a few properties. That usually makes an access agreement much easier to negotiate,” he said.
“All of the possible sites we’ve identified are near existing and approved high-power transmission lines.
“These maps show the relative cost of renewable energy on each 1000m x 1000m parcel of land for solar farms and 250m x 250m parcel for wind.” All land in Australia has been divided into different cost categories for solar and wind generation, ranging from Class A to Class E. Professor Blakers said Class A, B and C sites are strongly preferred.
More information about relative costs and renewable energy potential for every LGA in each state and territory can be accessed here. The most suitable locations across Australia are highlighted red and less preferred sites are outlined in pink or blue, while unsuitable areas, including urban areas, protected areas and native forests have been excluded from this study and are shown in green.
The heat maps use geographic information to identify the best possible locations.
Support for this research from CWP Renewables and Innovation Connections is gratefully acknowledged.
Disclaimer
No land identified in these maps has been the subject of any other studies, and it is not known whether any particular area would be suitable. The commercial feasibility of developing any location is unknown. As with all major engineering projects, diligent attention to quality assurance would be required for safety and efficacy. The publicly available datasets used for this work contain inaccuracies. Results should be viewed as indicative.
To discuss this project further, please contact Professor Andrew Blakers (0417 390 139).
This tool has been featured in the Conversation, The West Australian, The Courier, elsewhere through AAP, by 7news, and Renew Economy.