Contact: Andrew Blakers, andrew.blakers@anu.edu.au
Investigators: Andrew Blakers, Anna Nadolny, Timothy Weber, Cheng Cheng
A pumped hydro energy storage (PHES) site comprises two reservoirs at different altitudes spaced a few km apart and connected with a tunnel or pipe containing a pump/turbine. On sunny and windy days water is pumped uphill to the upper reservoir. The stored energy can be recovered later on by allowing water to flow back downhill through the tunnel or pipe and then the turbine. The larger the difference in altitude, or head, the better. Short pressure tunnels are preferred.
Our Atlases currently contain 820,000 non-overlapping sites with 86 million GWh of energy storage potential which is equivalent to about 2 trillion EV batteries. Most of the Atlas sites are off-river and do not require any new dams on rivers. Land and water use is very low. PHES constitutes >90% of electricity storage worldwide because of its low cost. Batteries are preferred for storage of seconds to hours, and PHES for overnight and longer.
Using the Atlases:
- Users can pan, zoom, rotate, and tilt.
- Click on “Explore Map Data” to add and combine data layers
- Select Map Settings/3D Terrain for a 3D view.
- Clicking on a reservoir or a tunnel route produces different information popups containing 26 items of detailed information.
- The best sites are marked with stars (cost Class AAA), triangles (Class AA), or dark red dots (Class A). Lower classes comprise B, C, D and E
- Different sizes can be selected in the lefthand pane in the range 2 to 5000 GWh.
- Aqueducts or low-pressure tunnels in flat land often allow shorter pressure tunnels.
- The cost of new transmission can usually be shared with new solar and wind farms.
- An indicative cost model is included.
Pumped hydro pairs can be made up of many combinations, as seen in the table below.
| Type | Unprotected Area Atlas | Protected Area Atlas | Explanation |
| Greenfield | Unprotected Areas | Protected Areas | Two new reservoirs |
| Bluefield | Unprotected Areas | Protected Areas | At least one existing reservoir |
| Brownfield | Unprotected Areas | Protected Areas | Repurpose mining sites for pumped hydro reservoirs |
| Ocean | Unprotected Areas | Protected Areas | Use the ocean for the lower reservoir |
| Seasonal | Unprotected Areas | Protected Areas | Store water for longer periods |
| Turkey’s Nest | Unprotected Areas | Protected Areas | Create PHES reservoirs on flat ground, for more siting options |
Our atlases have been used by Governments and private companies all around the world to locate prospective sites for pumped hydro energy storage, including NSW, QLD, India and the World Bank. The vast availability of off-river pumped hydro greatly changes perceptions of the cost of providing large-scale storage, because water is so cheap compared with electrochemicals.
Pumped Hydro Energy Storage Cost Model
Pumped Hydro Energy Storage Guidelines
Key Publications and Documents#
- Matthew Stocks, Ryan Stocks, Bin Lu, Cheng Cheng, Andrew Blakers, 2021, ‘Global Atlas of Closed-Loop Pumped Hydro Energy Storage’, Joule, vol. 5, issue 1, pp. 270-284, Jan. 2021, doi: 10.1016/j.joule.2020.11.015.
- Andrew Blakers, Matthew Stocks, Bin Lu, Cheng Cheng, 2021, ‘A review of pumped hydro energy storage’, Progress in Energy, vol. 3, issue 2, 022003, March 2021, doi: 10.1088/2516-1083/abeb5b.
- Cheng Cheng, Andrew Blakers, Anna Nadolny, 11th November 2022, Batteries of gravity and water: we found 1,500 new pumped hydro sites next to existing reservoirs, The Conversation.
- Timothy Weber, Ryan Stocks, Andrew Blakers, Anna Nadolny, Cheng Cheng, ‘A global atlas of pumped hydro systems that repurpose existing mining sites’, Renewable Energy, 2024, 120113, ISSN 0960-1481, https://doi.org/10.1016/j.renene.2024.120113.
- Timothy Weber, Andrew Blakers, 27th February 2024, Researchers found 37 mine sites in Australia that could be converted into renewable energy storage. So what are we waiting for?, The Conversation.
- Andrew Blakers, Matthew Stocks, Bin Lu, 20 July 2020,Australian electricity options: pumped hydro energy storage, Parliamentary Library
All of our academic publications are available here, and our media publications are here.
Detailed spreadsheets for any part of the world are available upon request.
If you like our work then please write and tell us!
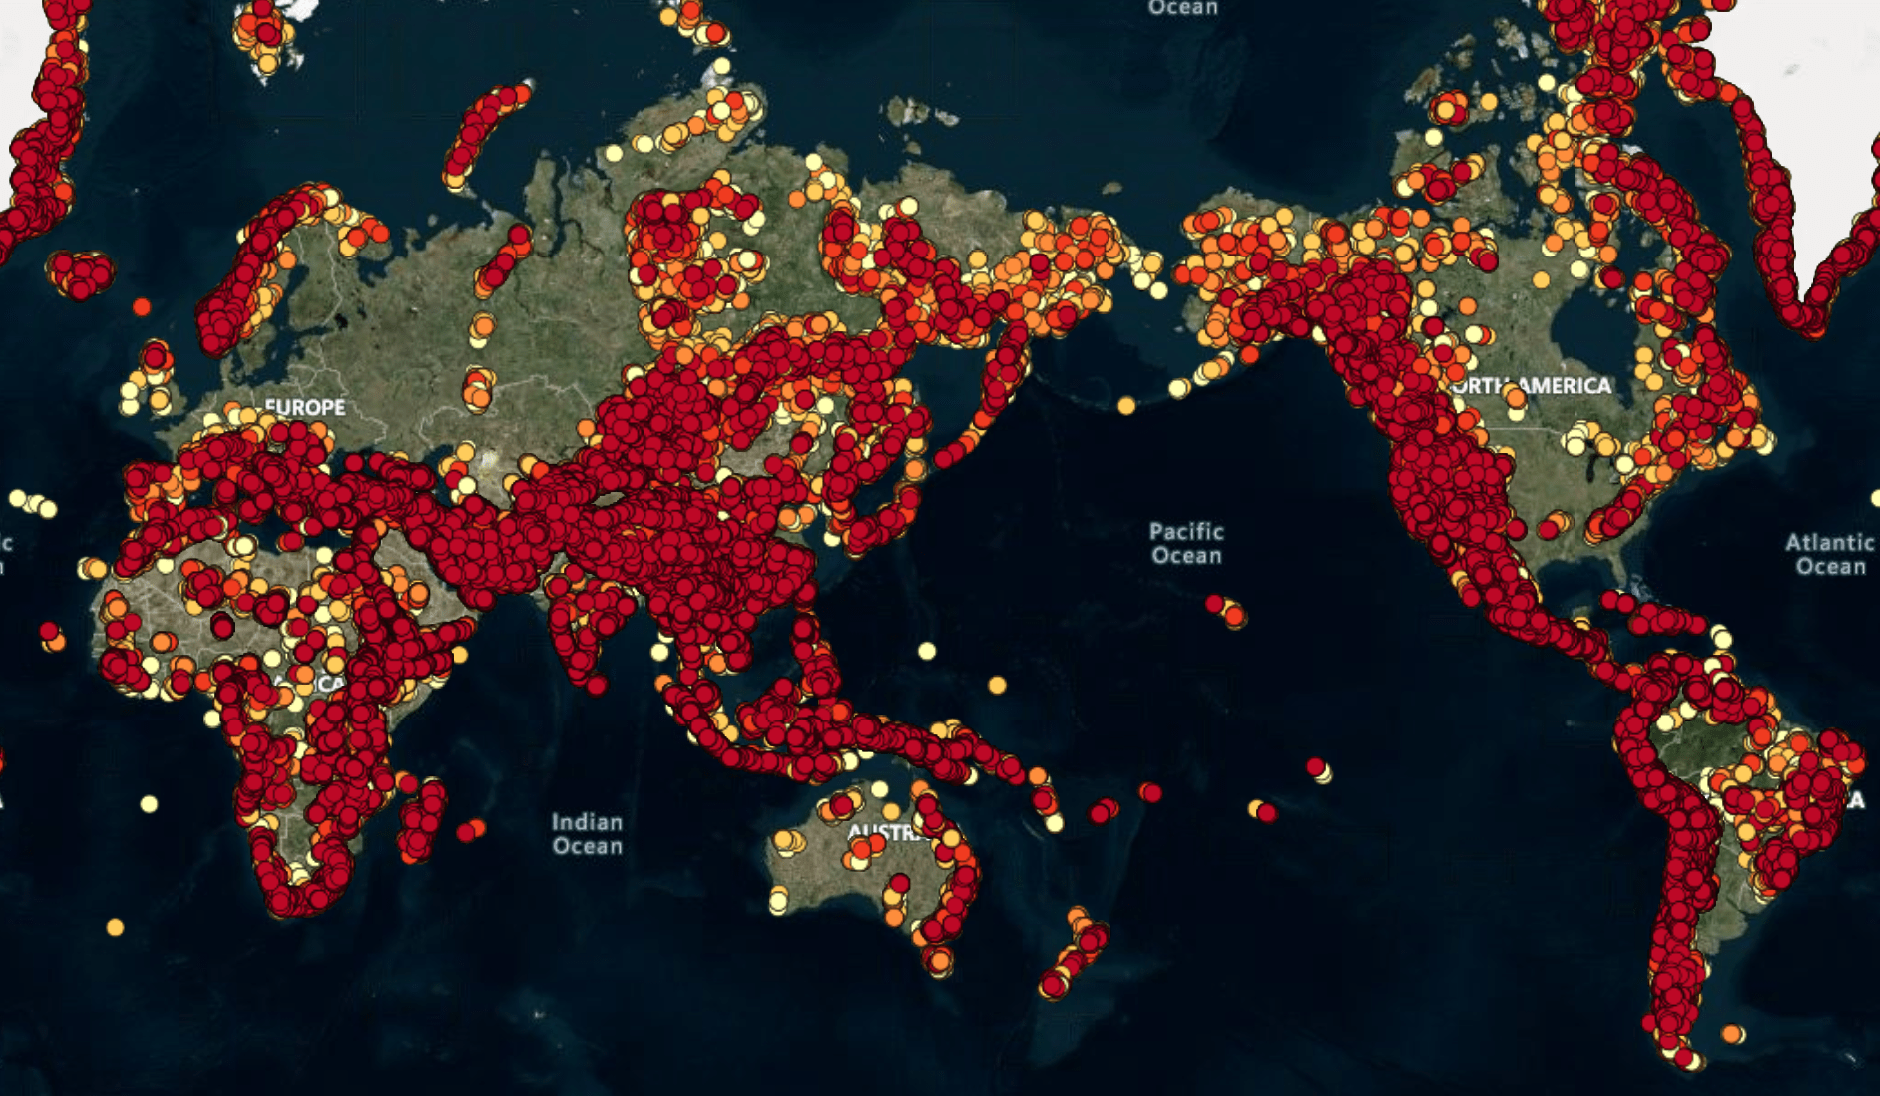 Figure 1. The Global Greenfield Pumped Hydro Atlas. The dots are colour coded. Red dots cost about half the pale yellow dots according to our cost model. Credits: Pumped hydro site data: RE100 Group ANU. Background: Bing Maps.
Disclaimer
None of the PHES sites discussed in this study have been the subject of geological, hydrological, environmental, heritage and other studies, and it is not known whether any particular site would be suitable. The commercial feasibility of developing these sites is unknown. As with all major engineering projects, diligent attention to quality assurance would be required for safety and efficacy. In particular, the suitability of existing dams for use as PHES reservoirs would need to be confirmed. Possible depth fluctuations are calculated using the surface area of each existing reservoir. The publicly available datasets used for this work contain inaccuracies – these depth fluctuations should be viewed as indicative. PHES pairs are presented with no limit on depth fluctuation of the existing reservoir, nor any analysis of environmental, social, geological, hydrological etc. impacts of these fluctuations.
There has been no investigation of land tenure apart from exclusion of some environmental areas and urban areas, and no discussions with land owners and managers. Nothing in this list of potential site locations implies any rights for development of these locations. Accuracy of the sites depends on the accuracy of the source data. There may be sites that fall into protected areas or urban areas that are not identified by the source data. In coastal regions there may be a number of lower reservoirs sitting on top of the ocean due to limited accuracy of the DEM data.
Greenfield global summary#
The results of our survey are shown in Figure 2. Most regions of the world have large numbers of potential sites nearby. PHES is mature off-the-shelf technology and is much cheaper than alternatives for large-scale energy storage. Solar PV and wind are in 1st and 2nd place respectively in terms of annual global net new capacity additions. PV, wind, PHES and high voltage DC and AC transmission together represent mature technologies that can reach 100% renewable electricity at modest cost [2], allowing large greenhouse gas emissions reductions.

Fig. 2. Energy storage potential by UN geo region [3] in units of Gigawatt-hours (GWh) per million people. A rough approximation of the storage required to support 100% renewable electricity for an advanced economy is 20 GWh per million people. Melanesia (42,000) and Canada (25,000) are off scale.
How much storage is needed?#
An approximate guide to storage requirements for 100% renewable electricity, based on analysis for Australia, is 1 Gigawatt (GW) of power per million people with 20 hours of storage, which amounts to 20 GWh per million people [2]. This is for a strongly-connected large-area grid (1 million km2) with good wind and solar resources in a high-energy-use country. Local analysis is required for an individual country. For example, Australia needs about 500 GWh (and has storage potential that is 300 times larger) and the USA needs about 7000 GWh (and has storage potential that is 200 times larger).
Finding PHES sites#
Potential sites for off-river PHES are identified using GIS algorithms [4] with defined search criteria. The surveyed latitude range is up to 60 degrees north and 56 degrees south [5]. For each reservoir the following attributes are identified:
- Latitude, longitude, and elevation of the reservoir
- Area of the reservoir (in hectares)
- Water volume of the reservoir (in Gigalitres)
- Length of the dam (in meters)
- Dam wall height (in meters): the maximum height of earth and rock wall; different wall heights will produce different dam and reservoir shapes and volumes
- Volume of rock in the dam wall (in Gigalitres) based on a 3:1 upstream and downstream slopes
- Water-to-rock (W/R) ratio: ratio between volume of the stored water and volume of rock in the dam wall; reservoirs with higher water-to-rock ratio are economically more competitive.
For each pair of upper and lower reservoirs the following attributes are identified:
- Head (in meters): minimum altitude difference between potential upper and lower reservoirs
- Distance (in kms): minimum horizontal distance between potential upper and lower reservoirs
- Slope: ratio between the head and the distance
- The specifications for promising pairs of upper and lower reservoirs are: minimum head = 100m; maximum head is 800m; minimum W/R ratio = 3; minimum reservoir volume = 1 GL (corresponding approximately to 1 GWh of energy storage for 400m head); minimum slope between upper/lower reservoir pairs = 1:20. In this work the identified sites assume earth and rock walls with a maximum height in the range 5-100 m.
Wall heights are adjusted for each reservoir in a pair to yield equal water volumes to achieve the targeted energy storage. Energy (= head * volume * density * g * efficiency) and storage-length combinations are provided in Table 1. The last line is the approximate number of people that the reservoirs could service for a 100% renewable electricity grid (see “How much storage is needed”).
| 2 GWh | 5 GWh | 15 GWh | 50 GWh | 150 GWh | 500 GWh | 1500 GWh | |
| 6 hours | ✓ | - | - | - | - | - | - |
| 18 hours | - | ✓ | ✓ | - | - | - | - |
| 50 hours | - | - | - | ✓ | ✓ | - | - |
| 168 hours | - | - | - | - | - | ✓ | - |
| 504 hours | - | - | - | - | - | - | ✓ |
| Millions of people | 0.1 | 0.25 | 0.75 | 2.5 | 7.5 | 25 | 75 |
Each reservoir pair is ranked A, B, C, D or E according to an approximate cost model. More expensive schemes than rank E are not included. Rank A reservoir pairs would be expected to cost around half that of rank E. Larger systems are generally more cost-effective than smaller systems. The main cost components are:
- Water-to-rock ratio (how much rock must be moved to dam a given volume of water)
- Head (a doubled head for a reservoir pair compared with another similar pair provides doubled stored energy and the power component costs also reduce due to smaller water volumes)
- Slope between the reservoirs: the steeper the slope the shorter is the high-pressure tunnel/pipe. Water conveyances in a pair are the shortest distances between the reservoirs
- Power: lower power systems are less expensive for a given energy storage volume
The algorithm considers all possible pairs within a region, calculates the best pair according to a cost model, and works downwards in ranking. Each upper reservoir is paired with the best available lower reservoir. This explains why some water conveyances (e.g., a B-class pair) bypass a close reservoir and go to a more distant reservoir (e.g., because the “nearby” reservoir forms part of an A-class pair).
No pairs intrude on the national parks or urban areas that are listed in the databases that we use. However, many of these databases are out-of-date or incomplete.
Land and water use#
Legacy fossil fuels can support and balance an electrical grid with a large proportion of variable renewable energy (solar PV and wind). However, as the renewable fraction approaches 100% then substantial storage is needed. Analysis of Australia showed that about 500 GWh of storage is needed to balance a 100% renewable electricity grid for 25 million people that includes strong interconnection over large areas (to smooth-out local weather) [2]. If the storage is mostly in the form of pumped hydro then 2-5 km2 is required per million people for the upper + lower reservoirs. This is smaller than one tenth of the area of land required for the corresponding solar and wind energy systems that the storage supports. Most of the identified sites are not near significant rivers. Larger reservoirs (50-150 GWh) are more economical with land than smaller reservoirs.
The water requirements of a renewable electricity system relying on PV, wind, pumped hydro storage and wide-area transmission is far less than for a corresponding coal-based system because cooling towers are not needed for renewables. An initial fill of a pumped hydro system is required, of about 20 Gigalitres per million people (based on analysis for Australia). This water is retained indefinitely in an off-river (closed-loop) pumped hydro system. In some areas annual evaporation exceeds rainfall and will need replacement. Evaporation suppressors can be used. The volume of water required to replace evaporation is a small fraction of agricultural water use and is far less than used in an electricity system based on coal.
Pumped hydro can help make better use of existing transmission. For example, if a solar farm is in a region where building more transmission is difficult then it can make the existing transmission work 3-4 times harder by making sure that it is operating at its load limit most of the time (including at night).
Many or even most potential pumped hydro sites may prove to be unsuitable. However, fewer than 1% of the identified sites are required to support a 100% renewable electricity grid. Developers and approval authorities can afford to be choosy.
Limitations#
The following aspects (amongst others) are being worked on:
- Appropriate methods for Brownfield sites (mine sites) are being developed to mitigate the dearth of information about their true shapes (and hence volumes).
- Improved visualization and data summaries will be developed.
- Improved databases to exclude protected and urban areas.
Access#
In publications or developments that use this information please acknowledge the RE100 Group, Australian National University, http://re100.eng.anu.edu.au.
Acknowledgements#
Support from the Australian Centre for Advanced Photovoltaics, the Energy Transition Hub https://www.energy-transition-hub.org/, the Australia Indonesia Centre (https://australiaindonesiacentre.org/) and the Australian Renewable Energy Agency (https://arena.gov.au/) is gratefully acknowledged. NationalMap [5] is supported by Geoscience Australia and CSIRO/Data61. Special thanks is due to Mats Henrikson of Data61 (https://www.data61.csiro.au/) for mounting the data on NationalMap. Thanks also to David Singleton.
References#
- 100% renewable electricity in Australia, Andrew Blakers, Bin Lu and Matthew Stocks, Australian National University, February 2017 http://www.sciencedirect.com/science/article/pii/S0360544217309568
- 90-100% renewable electricity for the South West Interconnected System of Western Australia, Bin Lu, Andrew Blakers and Matthew Stocks, Australian National University, March 2017 https://www.sciencedirect.com/science/article/pii/S0360544217300774
- UN geo regions: https://unstats.un.org/unsd/methodology/m49/
- Algorithms: https://www.sciencedirect.com/science/article/pii/S0306261918305270
- NationalMap: https://nationalmap.gov.au/renewables/
Source Data#
- Improved cost model
- SRTM 1 Arc-Second Global Digital Elevation Models https://earthexplorer.usgs.gov/
- World Database Protected Areas: https://www.protectedplanet.net/
- Urban extent: HBASE http://sedac.ciesin.columbia.edu/data/set/ulandsat-hbase-v1/data-download
- 100% renewable electricity in Australia, Andrew Blakers, Bin Lu and Matthew Stocks, Australian National University, February 2017 http://www.sciencedirect.com/science/article/pii/S0360544217309568
- PHES Searching Github site
The RE100 Map is based on TerriaJS and TerriaMap, initially developed by CSIRO’s Data61 to assist with spatial data visualisations for government and research applications. The TerriaJS core software is available as a GitHub project (https://github.com/TerriaJS/terriajs) licensed under an Apache 2.0 license (https://www.apache.org/licenses/LICENSE-2.0). The TerriaMap website template is also available on GitHub (https://github.com/TerriaJS/TerriaMap). Additional details are available on the Terria website (https://terria.io/).
Banner image Fig. 1. ANU has identified 616,000 potential Greenfield sites around the world. Detailed zoomable maps are available at the link below. Credits: Pumped hydro site data: RE100 Group ANU. Background: Bing Maps.