Contact: Andrew Blakers
Investigators: Andrew Blakers, Bin Lu, Cheng Cheng, Ryan Stocks, Anna Nadolny, Timothy Weber
We are very grateful to Matthew Stocks for his remarkable contribution to this work.
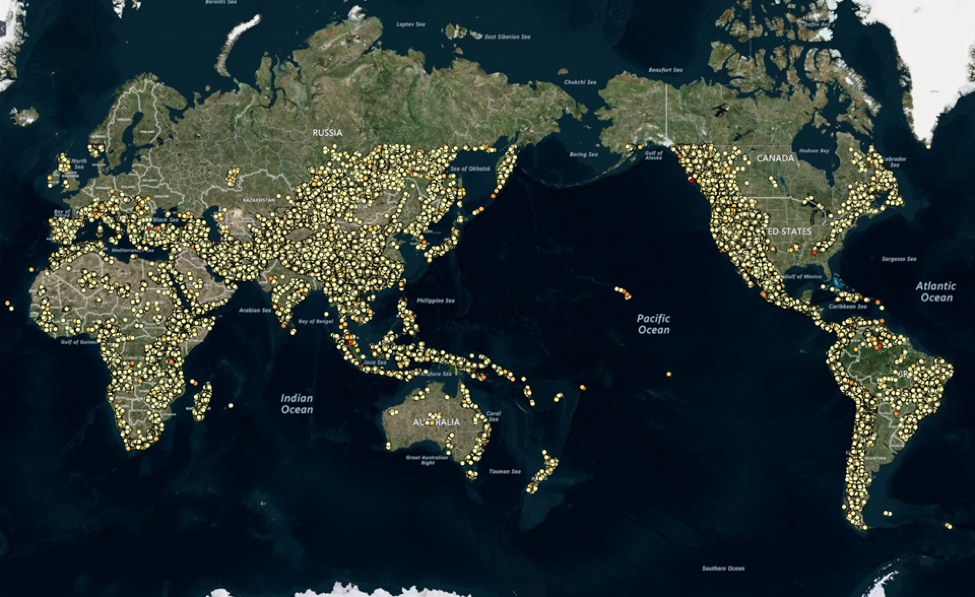
Fig. 1. ANU has identified 616,000 potential sites around the world. Detailed zoomable maps are available at the link below. Credits: Pumped hydro site data: RE100 Group ANU. Background: Bing Maps.
September 2022: We are pleased to share that when planning for new pumped hydro schemes, “The Queensland Government analysis used data from a range of sources including the 1,770 sites in the Australian National University (ANU) and Australian Renewable Energy Agency’s (ARENA) Project – An Atlas of Pumped Hydro Energy Storage. The Queensland Government undertook a risk-based, multi-criteria assessment to identify the best PHES sites at the lowest cost, and least impact …” The report can be downloaded here.
Click here for our new Bluefield atlas of Australia
Bluefield PHES use an existing reservoir to make a PHES pair – Greenfield PHES use two new reservoirs.
As the proportion of wind and solar photovoltaics (PV) in an electrical grid extends into the 50-100% range a combination of additional long-distance high voltage transmission, demand management and local storage is required for stability [1, 2]. Pumped Hydro Energy Storage (PHES) constitutes 97% of electricity storage worldwide because of its low cost.
We found about 616,000 potentially feasible PHES sites with storage potential of about 23 million Gigawatt-hours (GWh) by using geographic information system (GIS) analysis. This is about one hundred times greater than required to support a 100% global renewable electricity system. Brownfield sites (existing reservoirs, old mining sites) will be included in a future analysis.
Detailed global visualization is available at our dedicated mapping website.
Detailed spreadsheets for any part of the world are available upon request.
- CLICK HERE for a direct link to the maps. When zoomed in, you can click on a reservoir or coloured dot for information pop-ups. You can select the type of map (2D, 3D, terrain etc.) in the upper RH corner.
- A global atlas of pumped hydro energy storage (PDF, 1.2 M)
- Global summary spreadsheet (xlsx, 55 K)
If you like our work then please write and tell us!
Additional Work for the Global Pumped Hydro Atlas
Contact: Andrew Blakers
Detailed Spreadsheets for the Global Pumped Hydro Atlas
Contact: Andrew Blakers
Disclaimer
None of the PHES sites discussed in this study have been the subject of geological, hydrological, environmental, heritage and other studies, and it is not known whether any particular site would be suitable. The commercial feasibility of developing these sites is unknown. As with all major engineering projects, diligent attention to quality assurance would be required for safety and efficacy.
There has been no investigation of land tenure apart from exclusion of some environmental areas and urban areas, and no discussions with land owners and managers. Nothing in this list of potential site locations implies any rights for development of these locations. Accuracy of the sites depends on the accuracy of the source data. There may be sites that fall into protected areas or urban areas that are not identified by the source data. In coastal regions there may be a few lower reservoirs sitting on top of the ocean due to limited accuracy of the DEM data.
Global summary#
The results of our survey are shown in Figure 2. Most regions of the world have large numbers of potential sites nearby. PHES is mature off-the-shelf technology and is much cheaper than alternatives for large-scale energy storage. Solar PV and wind are in 1st and 2nd place respectively in terms of annual global net new capacity additions. PV, wind, PHES and high voltage DC and AC transmission together represent mature technologies that can reach 100% renewable electricity at modest cost [2], allowing large greenhouse gas emissions reductions.

Fig. 2. Energy storage potential by UN geo region [3] in units of Gigawatt-hours (GWh) per million people. A rough approximation of the storage required to support 100% renewable electricity for an advanced economy is 20 GWh per million people. Melanesia (42,000) and Canada (25,000) are off scale.
How much storage is needed?#
An approximate guide to storage requirements for 100% renewable electricity, based on analysis for Australia, is 1 Gigawatt (GW) of power per million people with 20 hours of storage, which amounts to 20 GWh per million people [2]. This is for a strongly-connected large-area grid (1 million km2) with good wind and solar resources in a high-energy-use country. Local analysis is required for an individual country. For example, Australia needs about 500 GWh (and has storage potential that is 300 times larger) and the USA needs about 7000 GWh (and has storage potential that is 200 times larger).
Finding PHES sites#
Potential sites for off-river PHES are identified using GIS algorithms [4] with defined search criteria. The surveyed latitude range is up to 60 degrees north and 56 degrees south [5]. For each reservoir the following attributes are identified:
- Latitude, longitude, and elevation of the reservoir
- Area of the reservoir (in hectares)
- Water volume of the reservoir (in Gigalitres)
- Length of the dam (in meters)
- Dam wall height (in meters): the maximum height of earth and rock wall; different wall heights will produce different dam and reservoir shapes and volumes
- Volume of rock in the dam wall (in Gigalitres) based on a 3:1 upstream and downstream slopes
- Water-to-rock (W/R) ratio: ratio between volume of the stored water and volume of rock in the dam wall; reservoirs with higher water-to-rock ratio are economically more competitive.
For each pair of upper and lower reservoirs the following attributes are identified:
- Head (in meters): minimum altitude difference between potential upper and lower reservoirs
- Distance (in kms): minimum horizontal distance between potential upper and lower reservoirs
- Slope: ratio between the head and the distance
- The specifications for promising pairs of upper and lower reservoirs are: minimum head = 100m; maximum head is 800m; minimum W/R ratio = 3; minimum reservoir volume = 1 GL (corresponding approximately to 1 GWh of energy storage for 400m head); minimum slope between upper/lower reservoir pairs = 1:20. In this work the identified sites assume earth and rock walls with a maximum height in the range 5-100 m.
Wall heights are adjusted for each reservoir in a pair to yield equal water volumes to achieve the targeted energy storage. Energy (= head * volume * density * g * efficiency) and storage-length combinations are provided in Table 1. The last line is the approximate number of people that the reservoirs could service for a 100% renewable electricity grid (see “How much storage is needed”).
| 2 GWh | 5 GWh | 15 GWh | 50 GWh | 150 GWh | 500 GWh | 1500 GWh | |
| 6 hours | ✓ | - | - | - | - | - | - |
| 18 hours | - | ✓ | ✓ | - | - | - | - |
| 50 hours | - | - | - | ✓ | ✓ | - | - |
| 168 hours | - | - | - | - | - | ✓ | - |
| 504 hours | - | - | - | - | - | - | ✓ |
| Millions of people | 0.1 | 0.25 | 0.75 | 2.5 | 7.5 | 25 | 75 |
Each reservoir pair is ranked A, B, C, D or E according to an approximate cost model. More expensive schemes than rank E are not included. Rank A reservoir pairs would be expected to cost around half that of rank E. Larger systems are generally more cost-effective than smaller systems. The main cost components are:
- Water-to-rock ratio (how much rock must be moved to dam a given volume of water)
- Head (a doubled head for a reservoir pair compared with another similar pair provides doubled stored energy and the power component costs also reduce due to smaller water volumes)
- Slope between the reservoirs: the steeper the slope the shorter is the high-pressure tunnel/pipe. Water conveyances in a pair are the shortest distances between the reservoirs.
- Power: lower power systems are less expensive for a given energy storage volume
The algorithm considers all possible pairs within a region, calculates the best pair according to a cost model, and works downwards in ranking. Each upper reservoir is paired with the best available lower reservoir. This explains why some water conveyances (e.g. a B-class pair) bypass a close reservoir and go to a more distant reservoir (e.g. because the “nearby” reservoir forms part of an A-class pair).
Virtually all upper reservoirs are away from rivers, and none intrude on the national parks or urban areas listed in the databases that we use. However, many of these databases are out-of-date or incomplete.
Land and water use#
Legacy fossil fuels can support and balance an electrical grid with a large proportion of variable renewable energy (solar PV and wind). However, as the renewable fraction approaches 100% then substantial storage is needed. Analysis of Australia showed that about 500 GWh of storage is needed to balance a 100% renewable electricity grid for 25 million people that includes strong interconnection over large areas (to smooth-out local weather) [2]. If the storage is mostly in the form of pumped hydro then 2-5 km2 is required per million people for the upper + lower reservoirs. This is smaller than one tenth of the area of land required for the corresponding solar and wind energy systems that the storage supports. Most of the identified sites are not near significant rivers. Larger reservoirs (50-150 GWh) are more economical with land than smaller reservoirs.
The water requirements of a renewable electricity system relying on PV, wind, pumped hydro storage and wide-area transmission is far less than for a corresponding coal-based system because cooling towers are not needed for renewables. An initial fill of a pumped hydro system is required, of about 20 Gigalitres per million people (based on analysis for Australia). This water is retained indefinitely in an off-river (closed-loop) pumped hydro system. In some areas annual evaporation exceeds rainfall and will need replacement. Evaporation suppressors can be used. The volume of water required to replace evaporation is a small fraction of agricultural water use and is far less than used in an electricity system based on coal.
Pumped hydro can help make better use of existing transmission. For example, if a solar farm is in a region where building more transmission is difficult then it can make the existing transmission work 3-4 times harder by making sure that it is operating at its load limit most of the time (including at night).
Many or even most potential pumped hydro sites may prove to be unsuitable. However, fewer than 1% of the identified sites are required to support a 100% renewable electricity grid. Developers and approval authorities can afford to be choosy.
Limitations#
The following aspects (amongst others) are being worked on:
- Brownfield sites (existing reservoirs, mine sites) are poorly handled at present due to lack of information about their true shapes (and hence volumes).
- Improved visualization and data summaries will be developed.
- Maximum head is set to 800m which is the limit of reversible francis turbines. Higher heads require separate of pumps and turbines which requires different costings
- Improved databases to exclude protected and urban areas
- Improved cost model
Access#
In publications or developments that use this information please acknowledge the RE100 Group, Australian National University, http://re100.eng.anu.edu.au.
Acknowledgements#
Support from the Energy Transition Hub https://www.energy-transition-hub.org/, the Australia Indonesia Centre (https://australiaindonesiacentre.org/) and the Australian Renewable Energy Agency (https://arena.gov.au/) is gratefully acknowledged. NationalMap [5] is supported by Geoscience Australia and CSIRO/Data61. Special thanks is due to Mats Henrikson of Data61 (https://www.data61.csiro.au/) for mounting the data on NationalMap. Thanks also to David Singleton.
References#
- 100% renewable electricity in Australia, Andrew Blakers, Bin Lu and Matthew Stocks, Australian National University, February 2017 http://www.sciencedirect.com/science/article/pii/S0360544217309568
- 90-100% renewable electricity for the South West Interconnected System of Western Australia, Bin Lu, Andrew Blakers and Matthew Stocks, Australian National University, March 2017 https://www.sciencedirect.com/science/article/pii/S0360544217300774
- UN geo regions: https://unstats.un.org/unsd/methodology/m49/
- Algorithms: https://www.sciencedirect.com/science/article/pii/S0306261918305270
- NationalMap: https://nationalmap.gov.au/renewables/
Source Data#
- Improved cost model
- SRTM 1 Arc-Second Global Digital Elevation Models https://earthexplorer.usgs.gov/
- World Database Protected Areas: https://www.protectedplanet.net/
- Urban extent: HBASE http://sedac.ciesin.columbia.edu/data/set/ulandsat-hbase-v1/data-download
- 100% renewable electricity in Australia, Andrew Blakers, Bin Lu and Matthew Stocks, Australian National University, February 2017 http://www.sciencedirect.com/science/article/pii/S0360544217309568
- PHES Searching Github site