A workshop to consider progress and potholes en route to 100% renewables, rapid emissions reductions and large-scale exports of Australian renewables.
This workshop follows on from the February 2019 workshop at ANU covering 100% renewables.
Presentations will be made public once we have received permission from the authors.
(https://www.dropbox.com/sh/qajm9vynno0dydp/AADzO1LzEu7sn-g_KCN54Iiua?dl=0) [Presentations can be accessed here]#
Location: Australian National University
Date and time: Tuesday-Wednesday, 18-19 February 2020
Participants: people covering technology, economics, social sciences, policy and politics
Cost: Free. We will provide morning and afternoon teas and lunches for the two days and dinner on the Tuesday evening.
Sponsors: ANU RE100 group (http://re100.eng.anu.edu.au/); ANU Energy Change Institute (https://energy.anu.edu.au/); ANU ZCEAP (https://www.anu.edu.au/research/research-initiatives/zero-carbon-energy-for-the-asia-pacific); Energy Transition Hub (https://www.energy-transition-hub.org/); Australian Centre for Advanced PV (http://www.acap.net.au/); University of NSW (https://www.engineering.unsw.edu.au/energy-engineering/).
A. 100% renewable energy and emissions reductions#
Australia is installing PV and wind at a rate above 5 GW per year (200 Watts per person per year), which is 4 times faster per capita than the EU, China, USA or Japan. If continued, this will cause rapid reductions in Australia’s greenhouse gas emissions.
The Renewable Energy Target led to large scale deployment of solar and wind farms. The Clean Energy Regulator lists 11 GW of accredited or committed solar and wind farms over 2018-20 (Fig. 1). Additionally, rooftop PV is being installed at a rate of around 2 GW per annum. Wind and PV currently supply about 20% of the electricity in the NEM compared with 15% a year ago (Fig. 2). Hydro averages an additional 6-8%. If the growth in deployment of PV and wind were to continue at the current rate, then Australia would reach 50% renewable electricity in 2024.
Rapid emissions reductions are tightly tied to the fortunes of the PV and wind industries. The terrible bushfires over the summer may cause a sudden large increase in emissions.
The December 2019 Department of Environment & Energy projections include a decline of 10 MT in emissions in the electricity sector from 2019 to 2020. The renewable energy fraction is projected to reach 48% in 2030. Emissions (as reported in Government quarterly reports) are likely to decline throughout 2020, 2021 and into 2022 because of rapid deployment of PV and wind over 2018-20.
__However, major impediments have arisen that threaten substantial reductions in further solar and wind investment. __
The approval process for new transmission in the National Electricity Market is slow and reactive. Some solar and wind farms are being significantly curtailed because of transmission constraints. There is no clear process for provision of new transmission in anticipation of substantial new PV and wind deployment (e.g. to a renewable energy zone). Ancillary services such as fast-response storage and synthetic inertia are poorly rewarded. The use of demand response mechanisms (e.g. to moderate the evening peak or to shift load to the middle of the day to soak up solar production) is inhibited. Following the achievement of the RET, there is little financial reward for the zero-carbon nature of PV and wind.
Discussion topics#
Technology#
- 10-year price trajectory for PV, onshore wind and offshore wind
- Battery storage
- Pumped hydro storage
- Snowy 2.0 and Marinus/battery of the nation
- HVDC/AC to Townsville, Alice, Perth, South Australia
- The rise of EVs and heat pumps as a large new market for renewables in the 2020s
Markets & emissions#
- Current deployment rates of PV and wind and trajectory of new commitments of PV & wind
- Emissions trajectory
- Transmission constraints and options for deploying new public or private transmission
- Ancillary services
- Demand management
- Renewable Energy Zones – public & private
- Other topics as suggested by participants
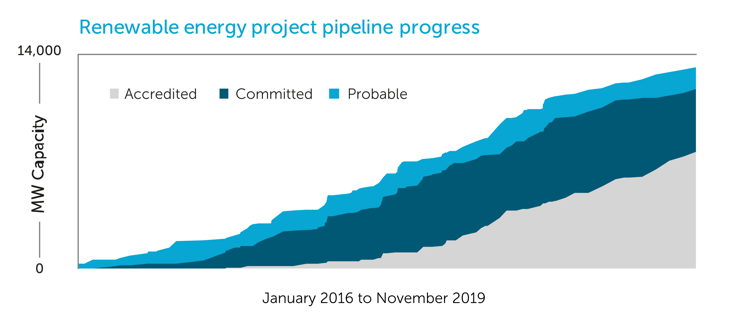
Figure 1. Clean Energy Regulator data shows strong growth in PV and wind farms, although transmission and other constraints may substantially curtail this pipeline in the future.
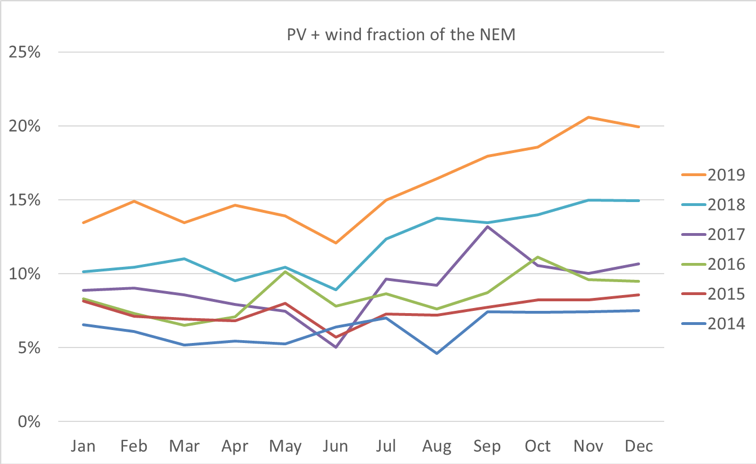 Figure 2. PV and wind fraction of the NEM over 2014–19.
## B. Export of Australian renewable energy
Australia has good wind and solar resources by international standards. Is it feasible to export large amounts of solar and wind energy?
Currently, commercial energy utilization is dominated by oil, gas and coal. In the future, commercial energy utilization is likely to be dominated by low-carbon solar and wind. Methods of exporting large amounts of renewable energy that could be technically feasible over the next few decades comprise:
- High Voltage DC (HVDC) undersea cable.
- Hydrogen-rich chemicals such as hydrogen, ammonia, synthetic hydrocarbons (methane, methanol, kerosene etc)
- Energy rich materials such as metals rather than metal oxides
State-of-the-art HVDC overland transmission is 12 GW at 1.1 MV, 3000 km with a loss of 10% and a cost of around $10/MWh. The red lines in Figure 3 are 3000 km long. Undersea HVDC has much lower capability at present: lower voltage, shorter cables, lower capacity and much more expensive.
Conversion of Australian renewable energy to a hydrogen-rich chemical such as methane or ammonia allows export of energy-rich liquids. However, the round-trip efficiency of Australian PV/wind electricity to electricity or motive energy in Asia is only 25-30%. Tough competition arises from the fact that NE Asia (Japan, Korea etc.) has moderately good sunshine and excellent wind (including very extensive offshore wind potential; Figure 4). These countries can also import PV/wind electricity from China and Mongolia via HVDC, although there are sensitive geopolitical issues.
Reduction of iron oxide and other oxides to metallic form within Australia allows the export of a more valuable and energy-rich material than the original ores. Iron is particularly important because of the huge volume of iron oxide exports from the Pilbara, which also happens to have excellent solar and good wind resources. Questions include whether industrialization of the Pilbara is feasible and whether China, Japan and other countries would accept the loss of part of the steel value-chain to Australia.
Discussion topics#
- How far away is technical and economic feasibility for large-scale RE exports?
- Round-trip efficiency of export modes
- Potential export markets
- Comparative costs of the export modes in the Asia-Pacific, especially NE Asia
- Competition from alternatives including natural gas, solar PV, on-shore wind and off-shore wind (including floating turbines)
- A source of sustainable carbon if synthetic hydrocarbons (e.g. methane) are to be exported
- Strategic and geopolitical constraints on a free and open energy market in places such as Japan, Taiwan, Korea, Indonesia and Germany
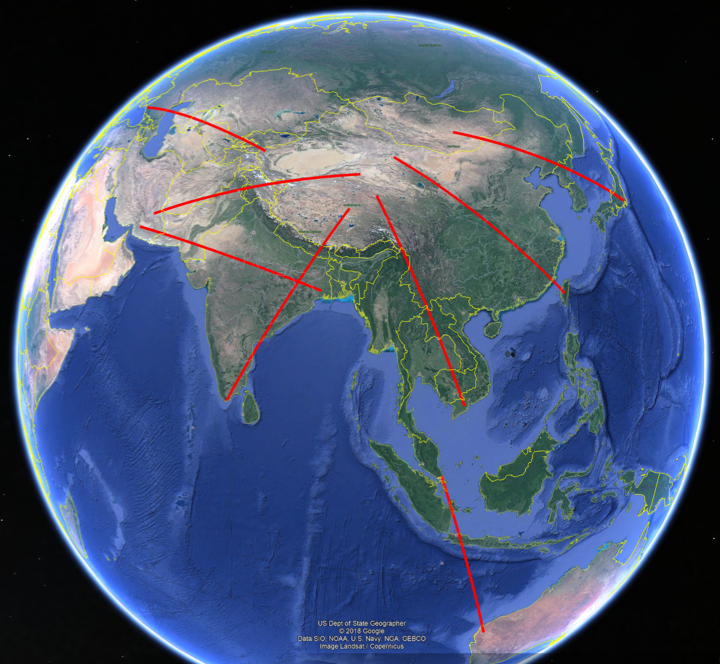 Figure 3. Much of the world’s population resides within current HVDC-range (3000 km) of central Asia. The red bars are each 3000 km long. Map: Google Earth.
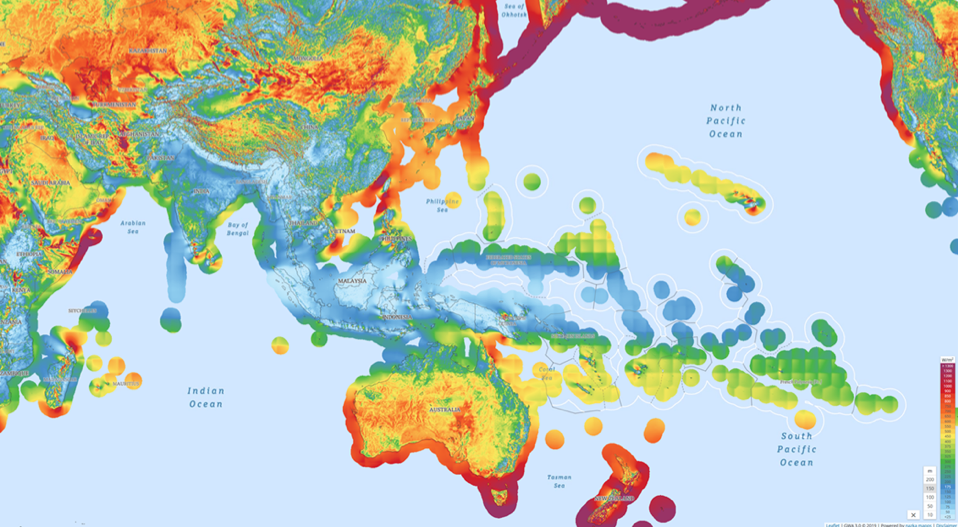
Figure 4. NE Asia and Australia are well-endowed with wind energy https://globalwindatlas.info/.