Solar and wind farms are being deployed at record levels in Australia and around the world. This trend is likely to continue over the next couple of decades because more generation will be required to meet the demand from electrified transport, heating and industry. But which regions stand to benefit most from large-scale solar and wind investments?
Our recent analysis answers this question at the level of Local Government Areas (LGAs). In summary, regional LGAs that have good wind and solar resources and that are close to cities and high voltage transmission will benefit most. They will share very large employment and revenue benefits from building, hosting, maintaining and renewing solar farms, wind farms, transmission lines and storage, worth many billions of dollars per year.
Electrifying transport, heating and industry will roughly double today’s electricity use. Adding in production of clean hydrogen for production of chemicals, metals and synthetic aviation fuel could triple current demand. We assumed that each state must supply 20 Megawatt-hours (MWh) per person each year from solar and wind farms (double current demand) and modelled two contrasting scenarios for electricity generation:
- High solar (67%) and low wind (33%)
- High wind (67%) and low solar (33%)
We divided Australia into small pixels (250m by 250m), ran the numbers on resource quality, distance to transmission and land‑use constraints, and aggregated the results to find out how much low-cost renewable generation each LGA would host.
Maps below show the best LGAs for solar and windfarms in Australia. These cluster in southeast Australia along high-power transmission corridors.
Also shown are premium-quality pumped hydro sites (Class AA), which can be used for large-scale low-cost energy storage to smooth solar‑and‑wind variability. Fortunately, most of Australia’s 300 premium-quality pumped hydro sites are located close to the best LGAs, and close to Brisbane-Sydney-Melbourne transmission.
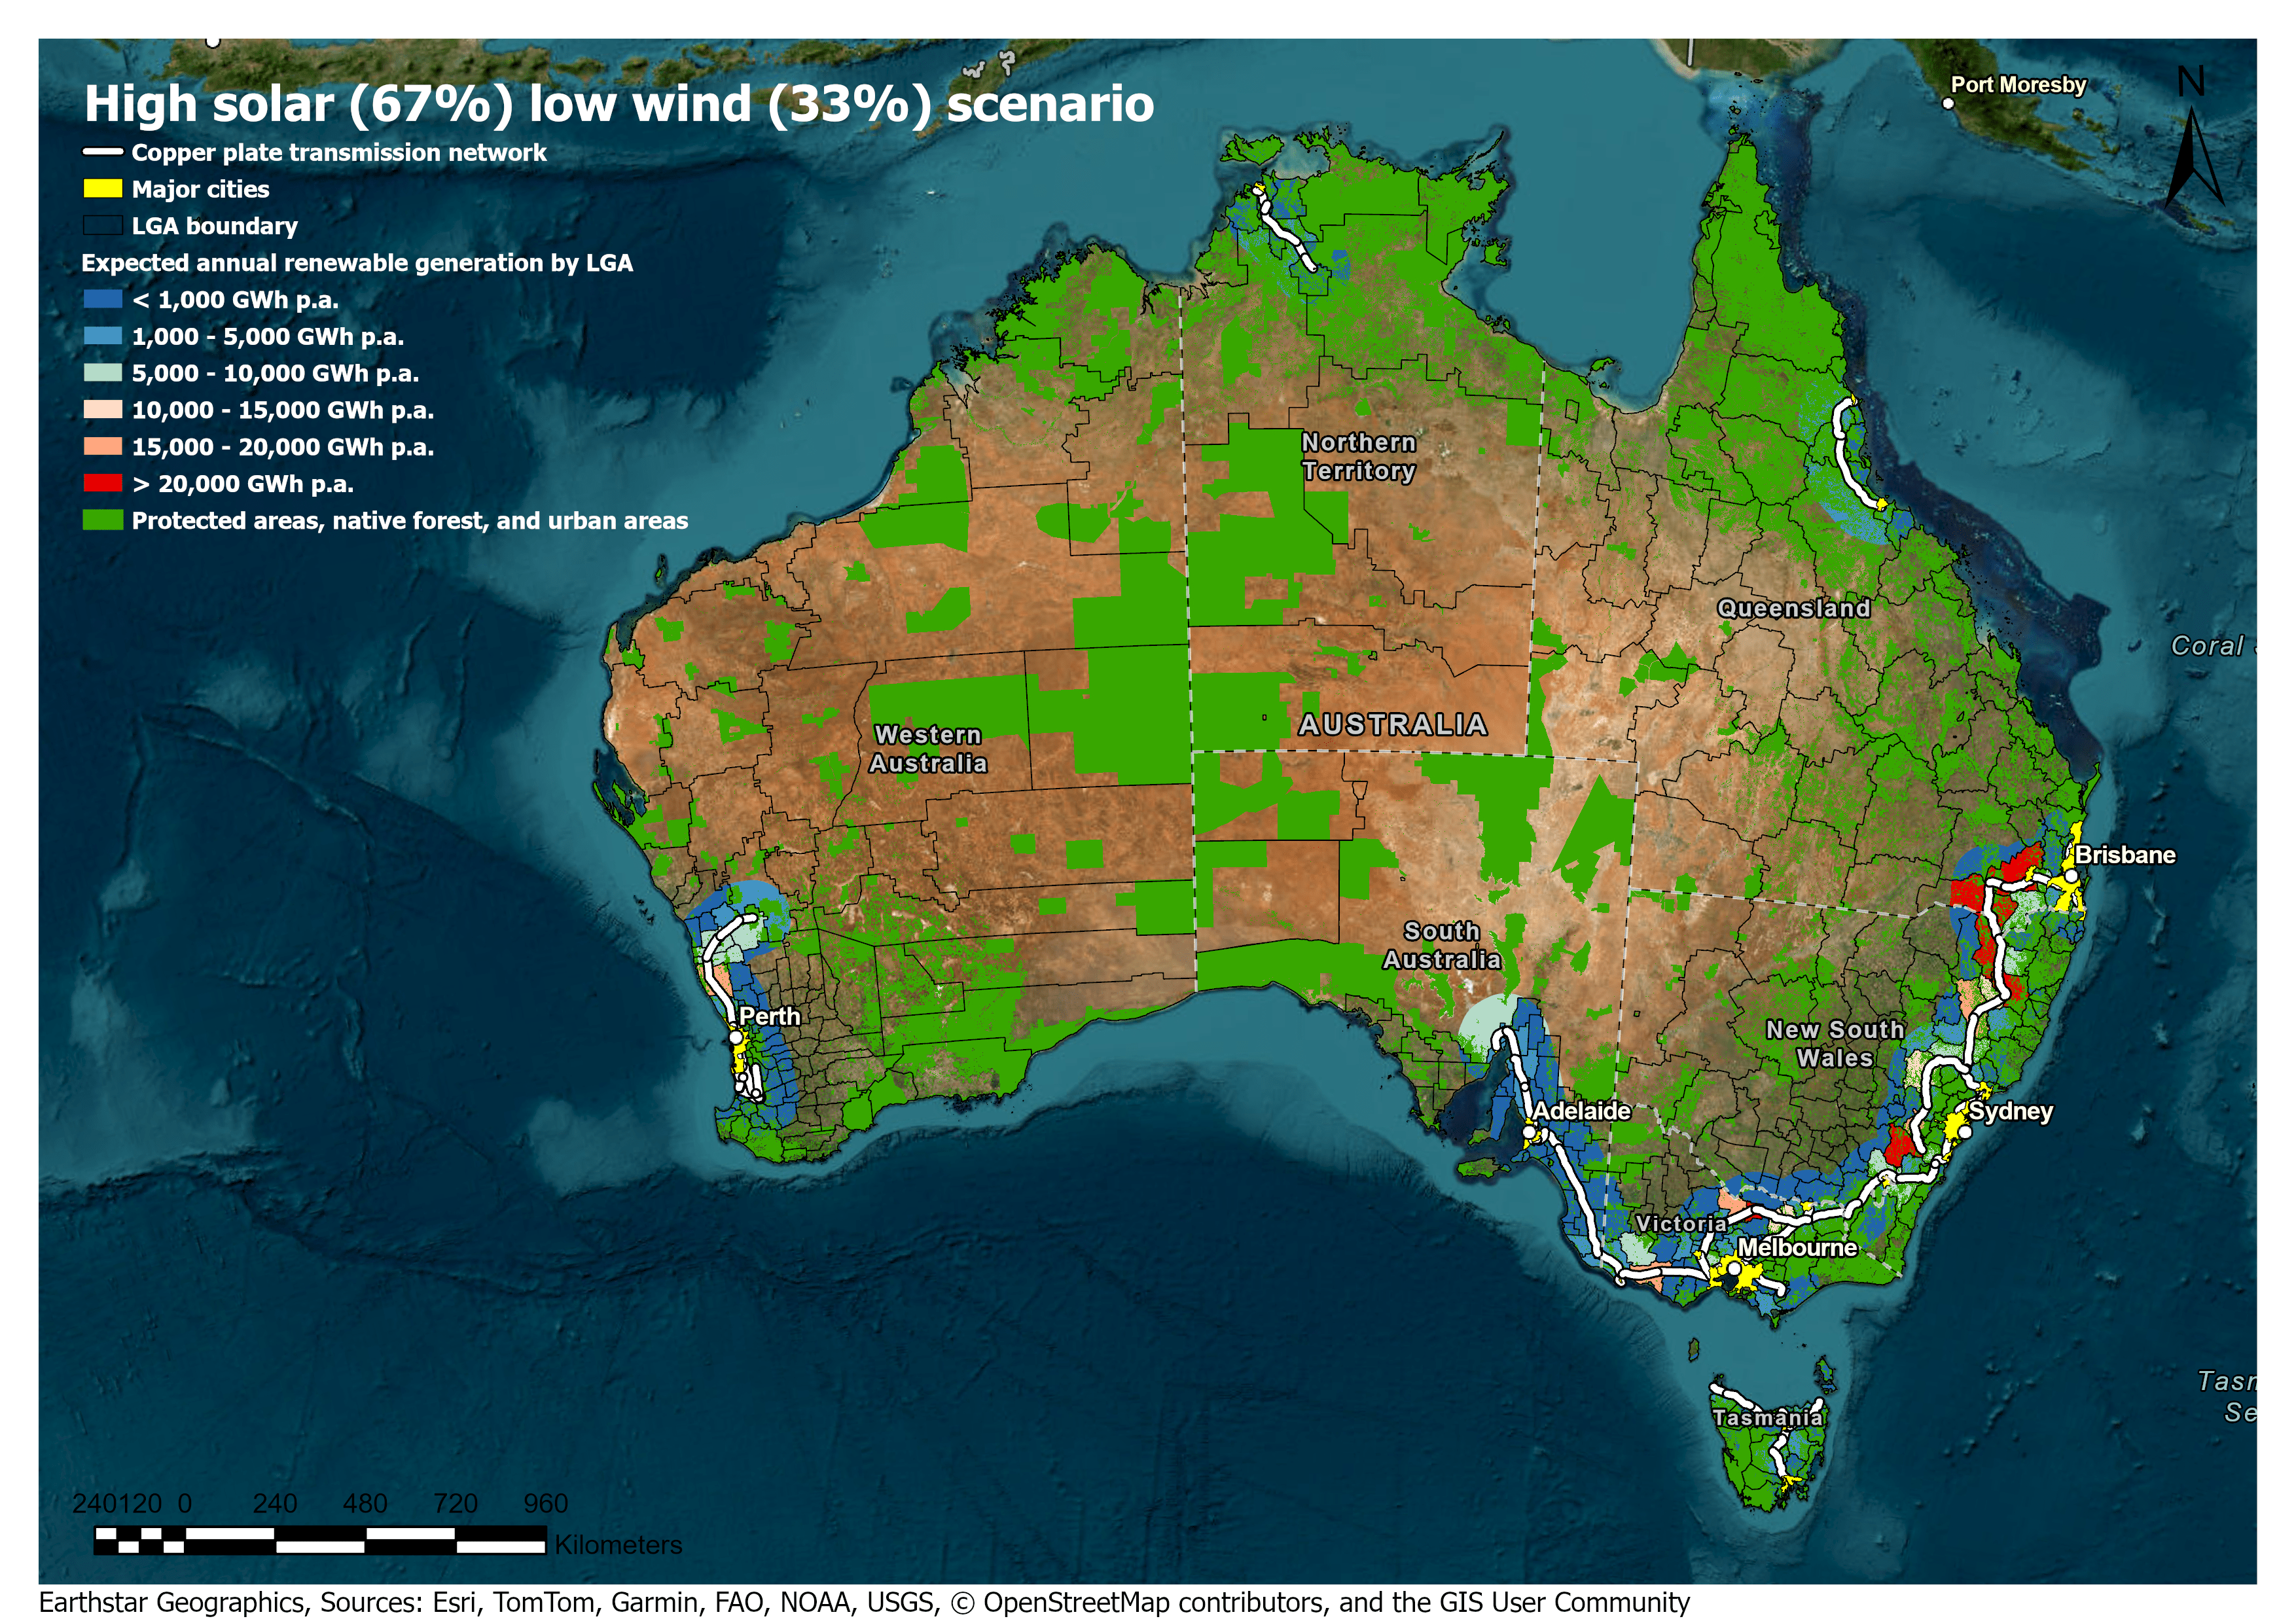
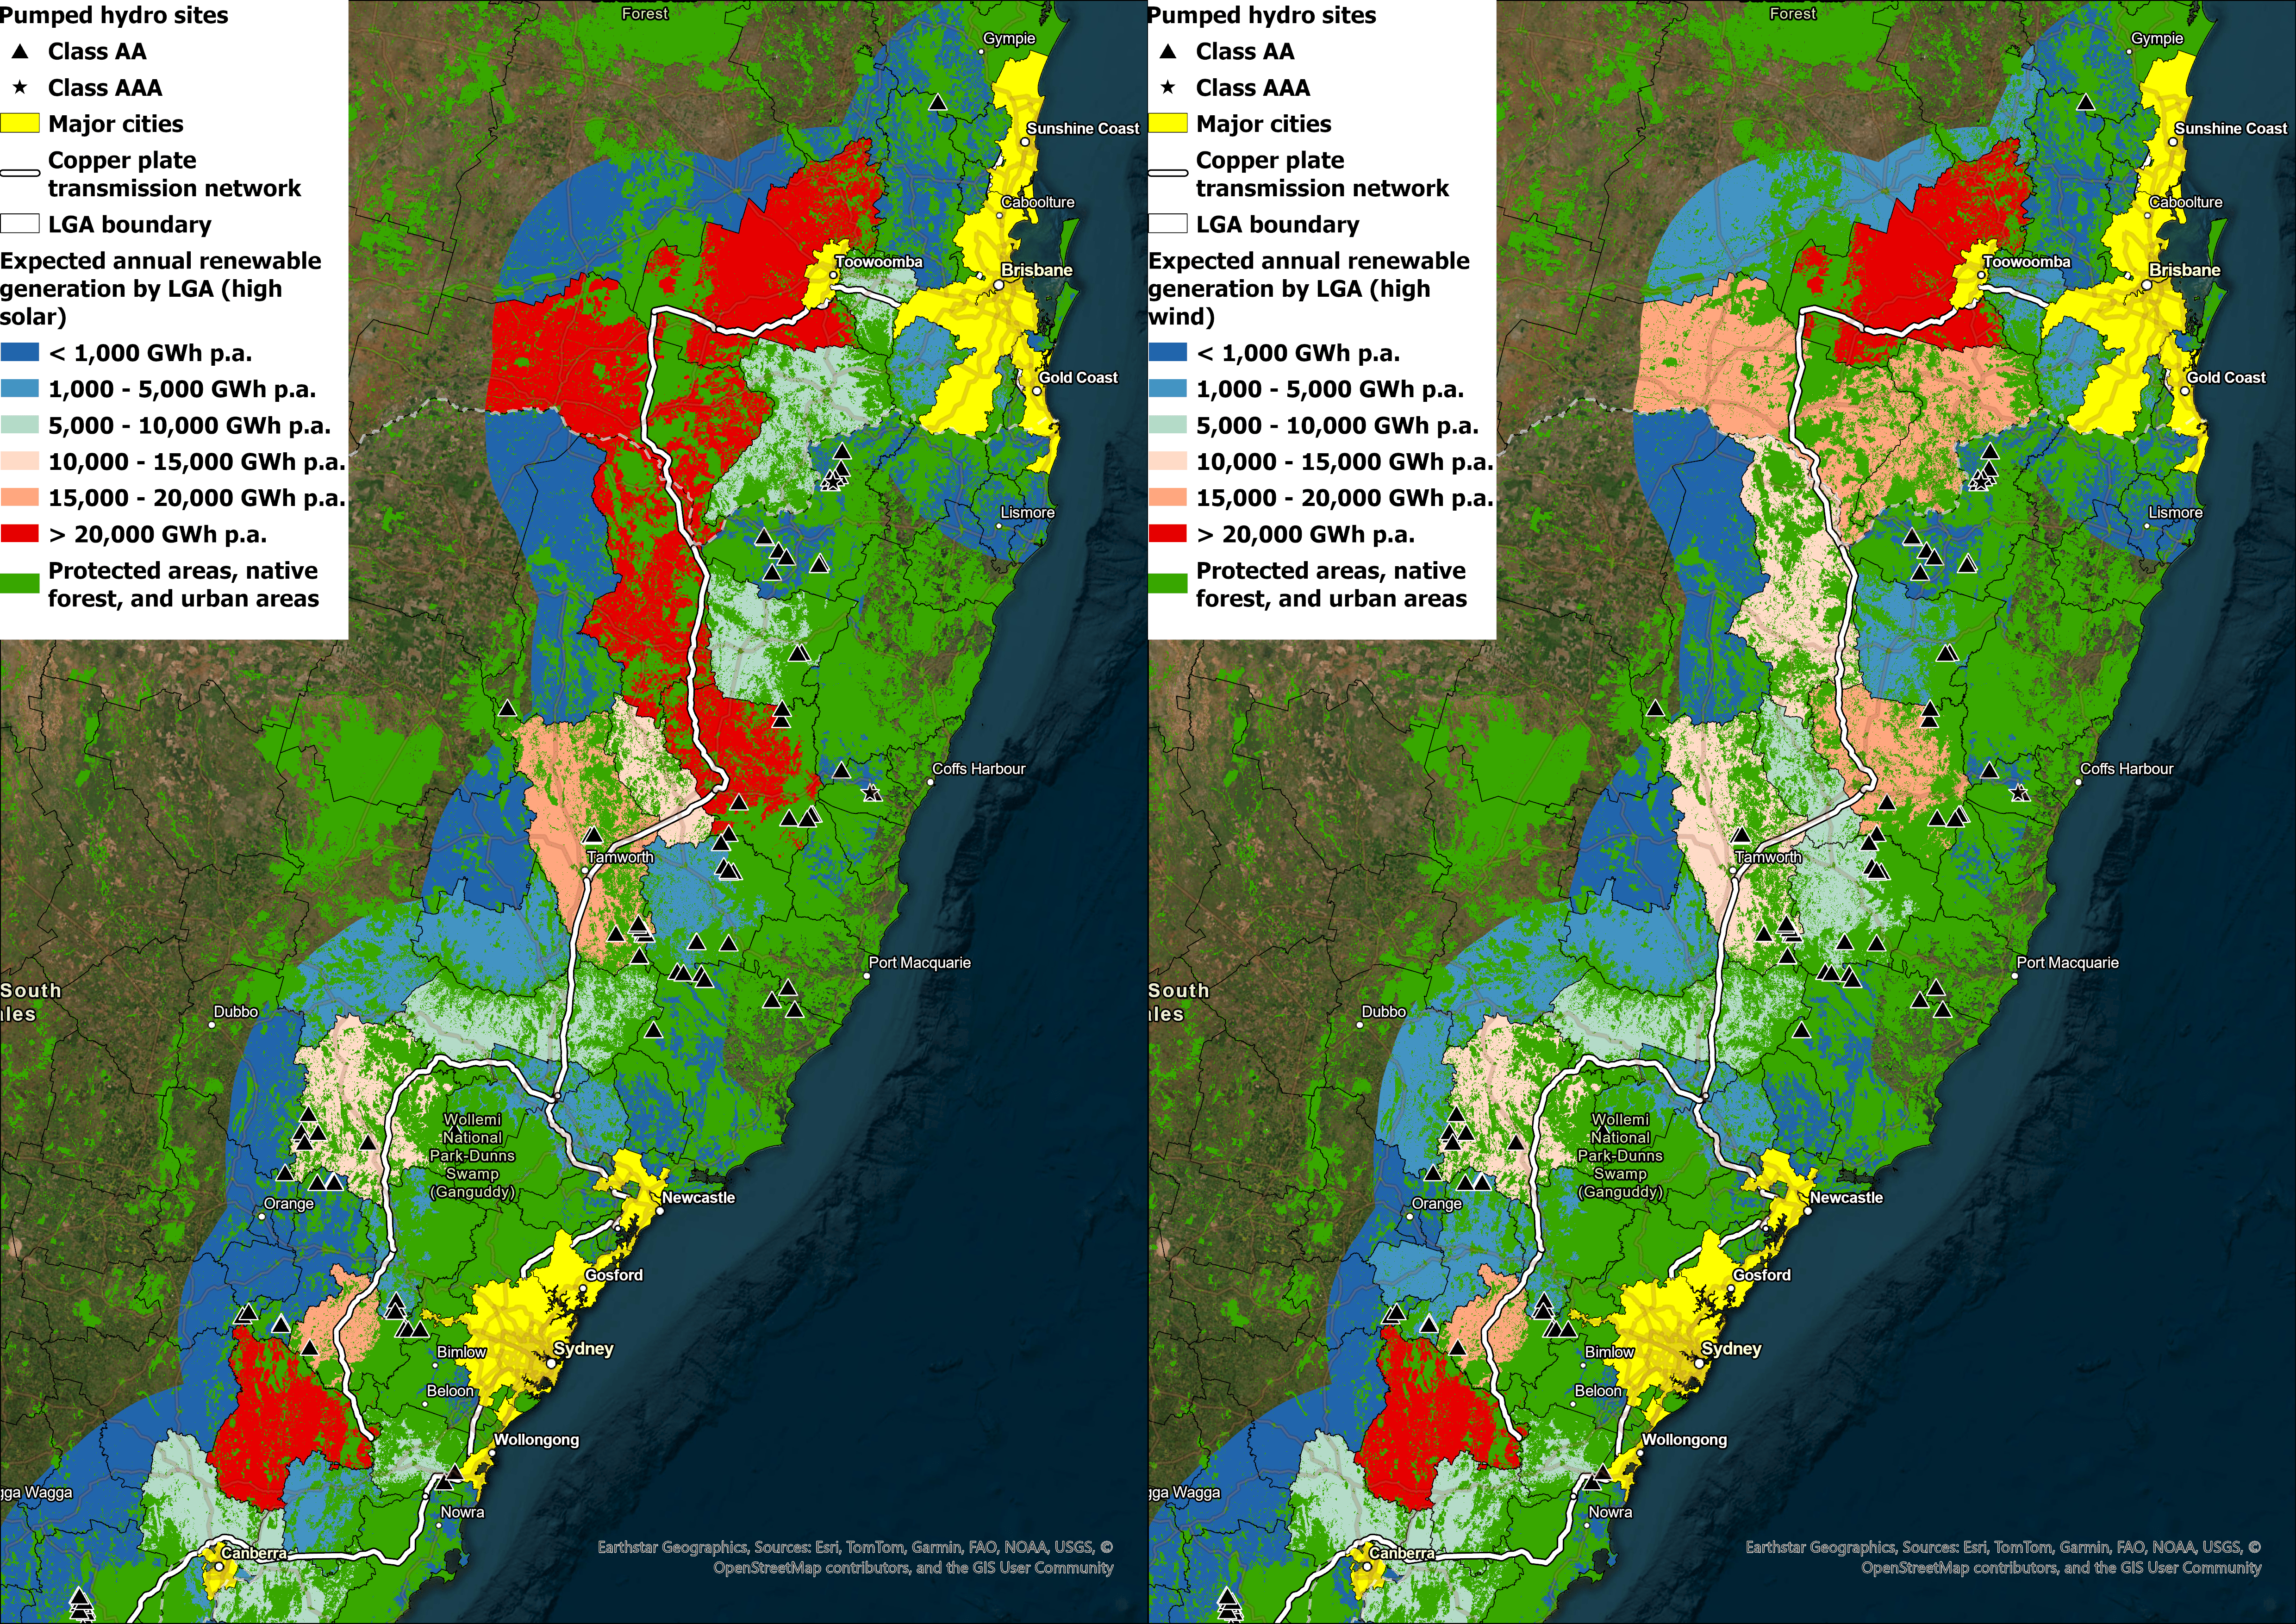
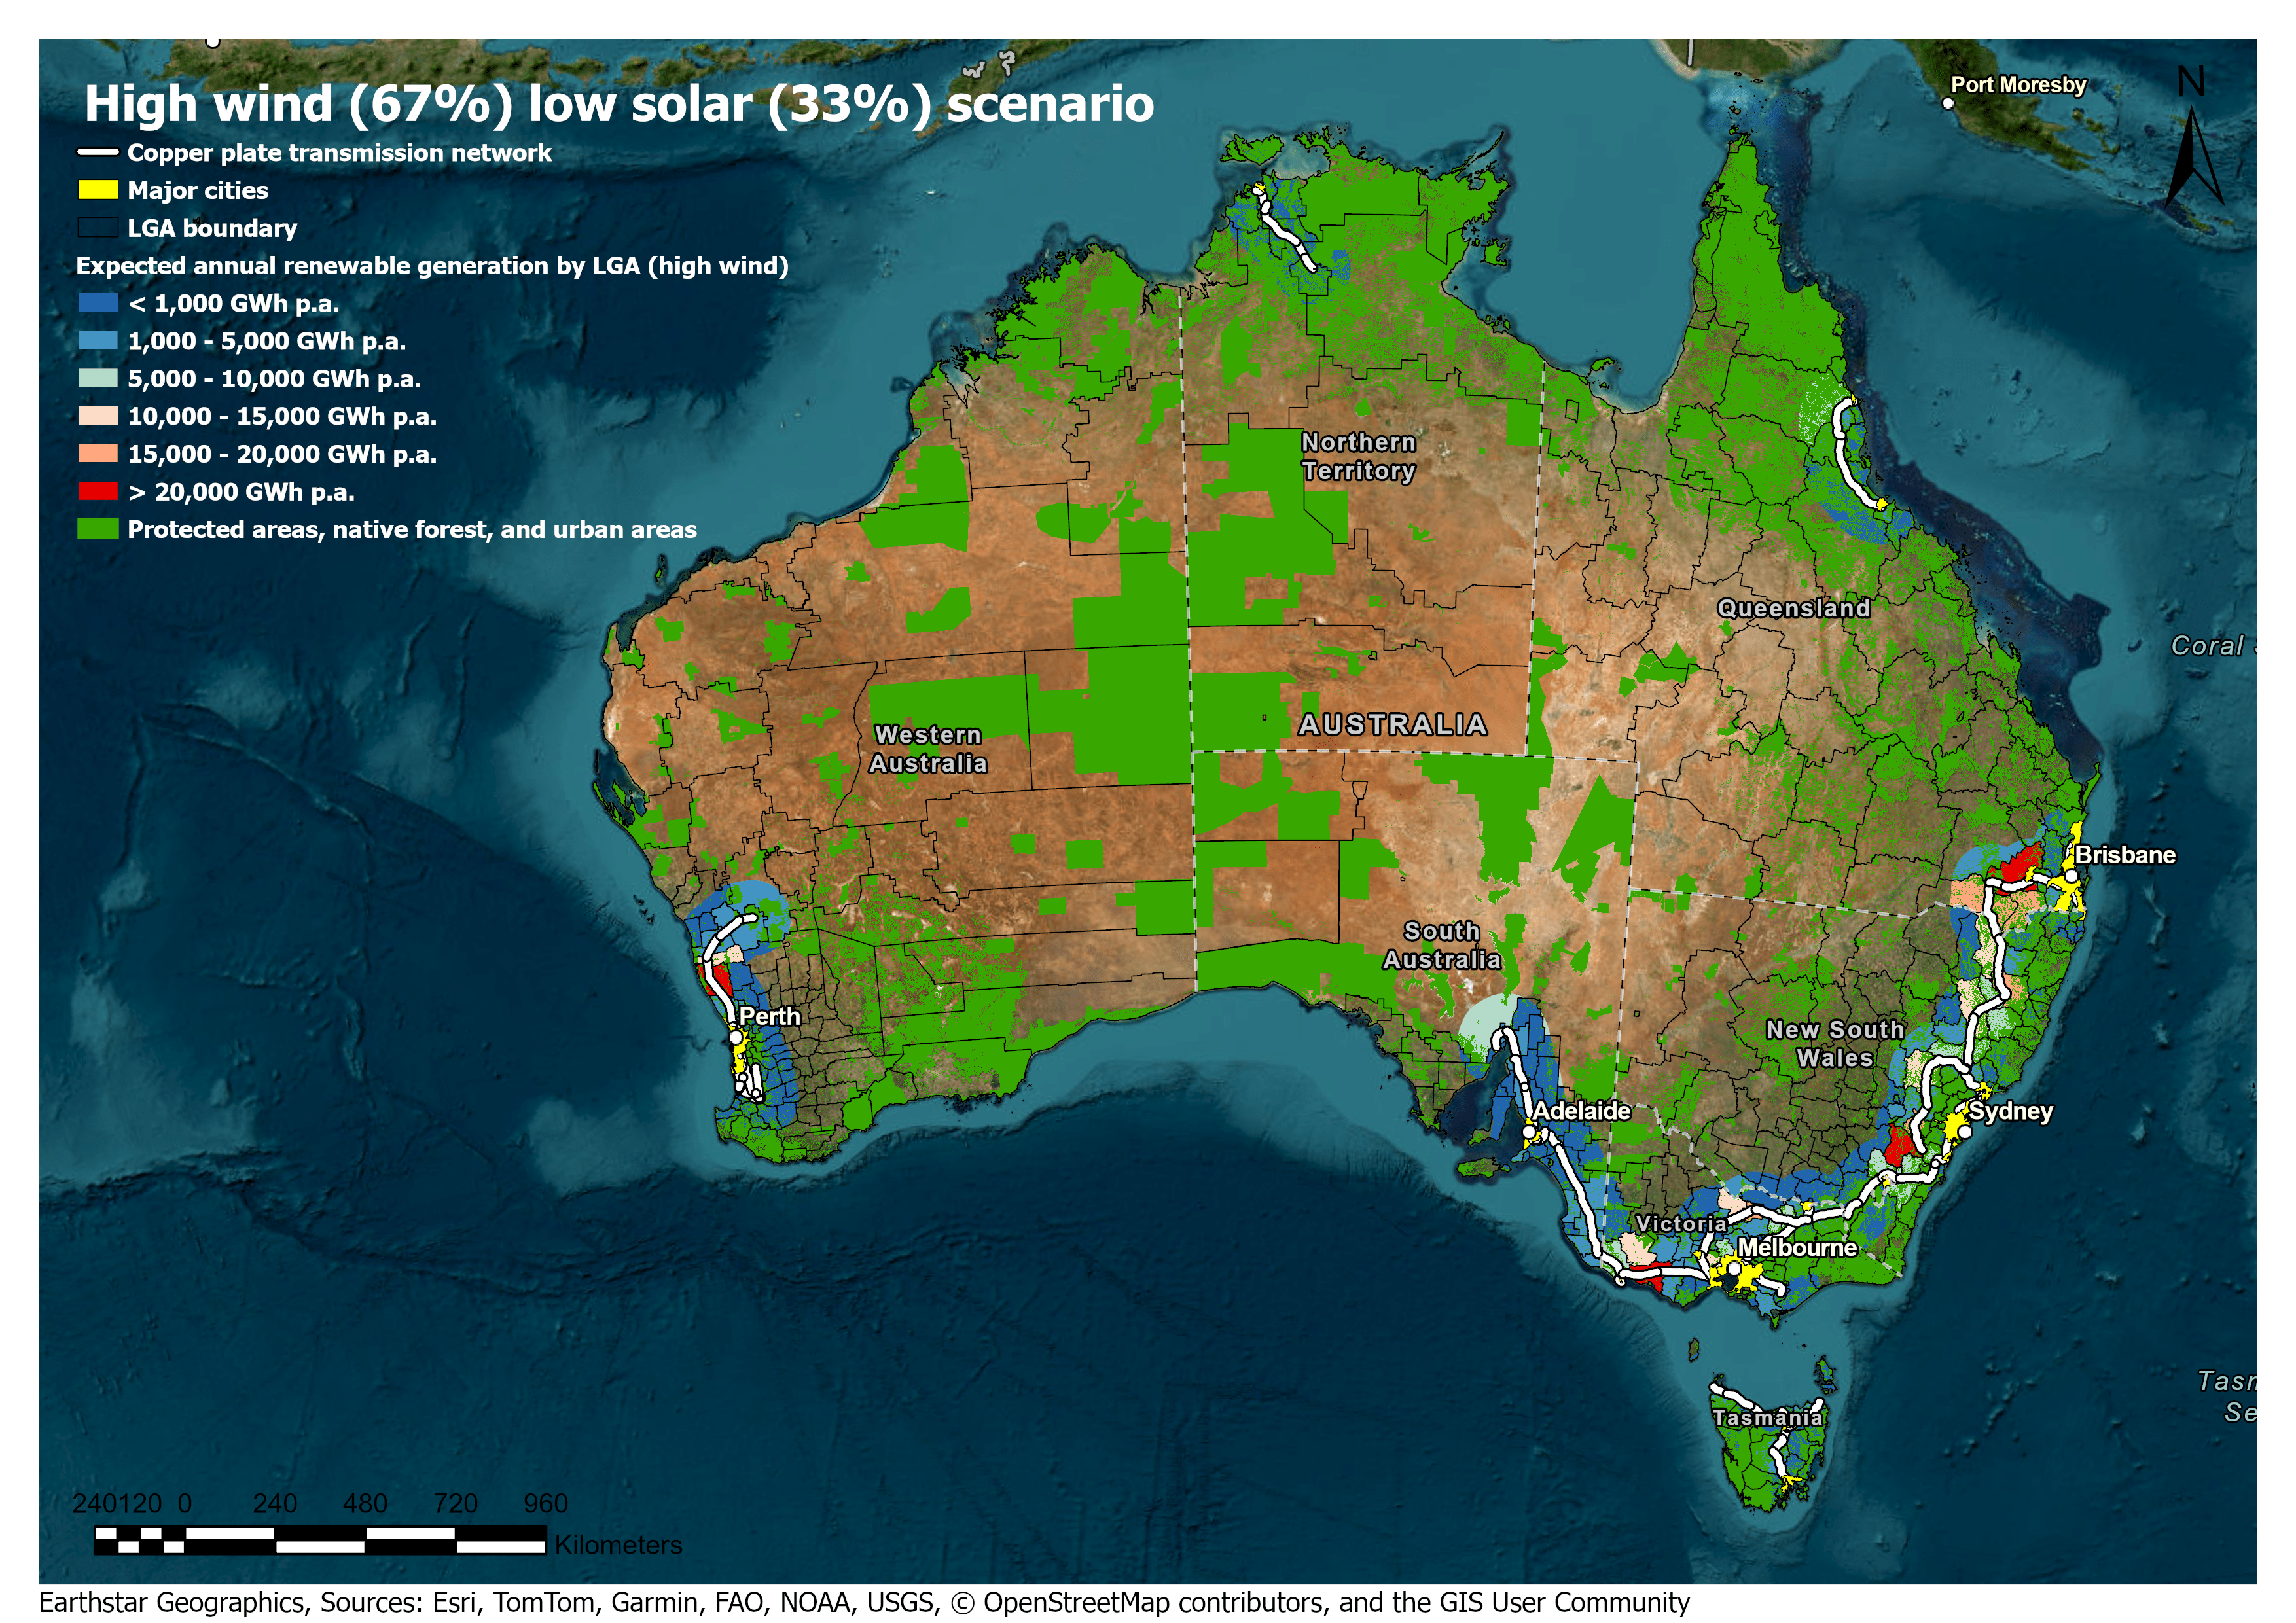
Figure 1: The best Solar and wind LGAs. Redder is better. Green is unsuitable areas. A “copper‑plate” high voltage transmission backbone that links the largest population centres is shown as a white line.
High-resolution zoomable maps and detailed statistics for each LGA can be accessed through this link.
There is large overlap between the LGAs that are best for high solar and high wind scenarios. Most of the best LGAs are around the transmission network, which is no surprise given that shorter distance to high power transmission cuts costs dramatically. Roughly speaking, low-cost pixels must be within 100km of transmission (the coloured range in Figure 1).
Figure 2 shows LGAs that gain more generation in a solar‑heavy mix (reds) versus a wind‑heavy mix (blues), with pale zones largely indifferent. It offers a quick visual cue for planners to see where tilting policy toward extra solar or wind would deliver the biggest local boost.
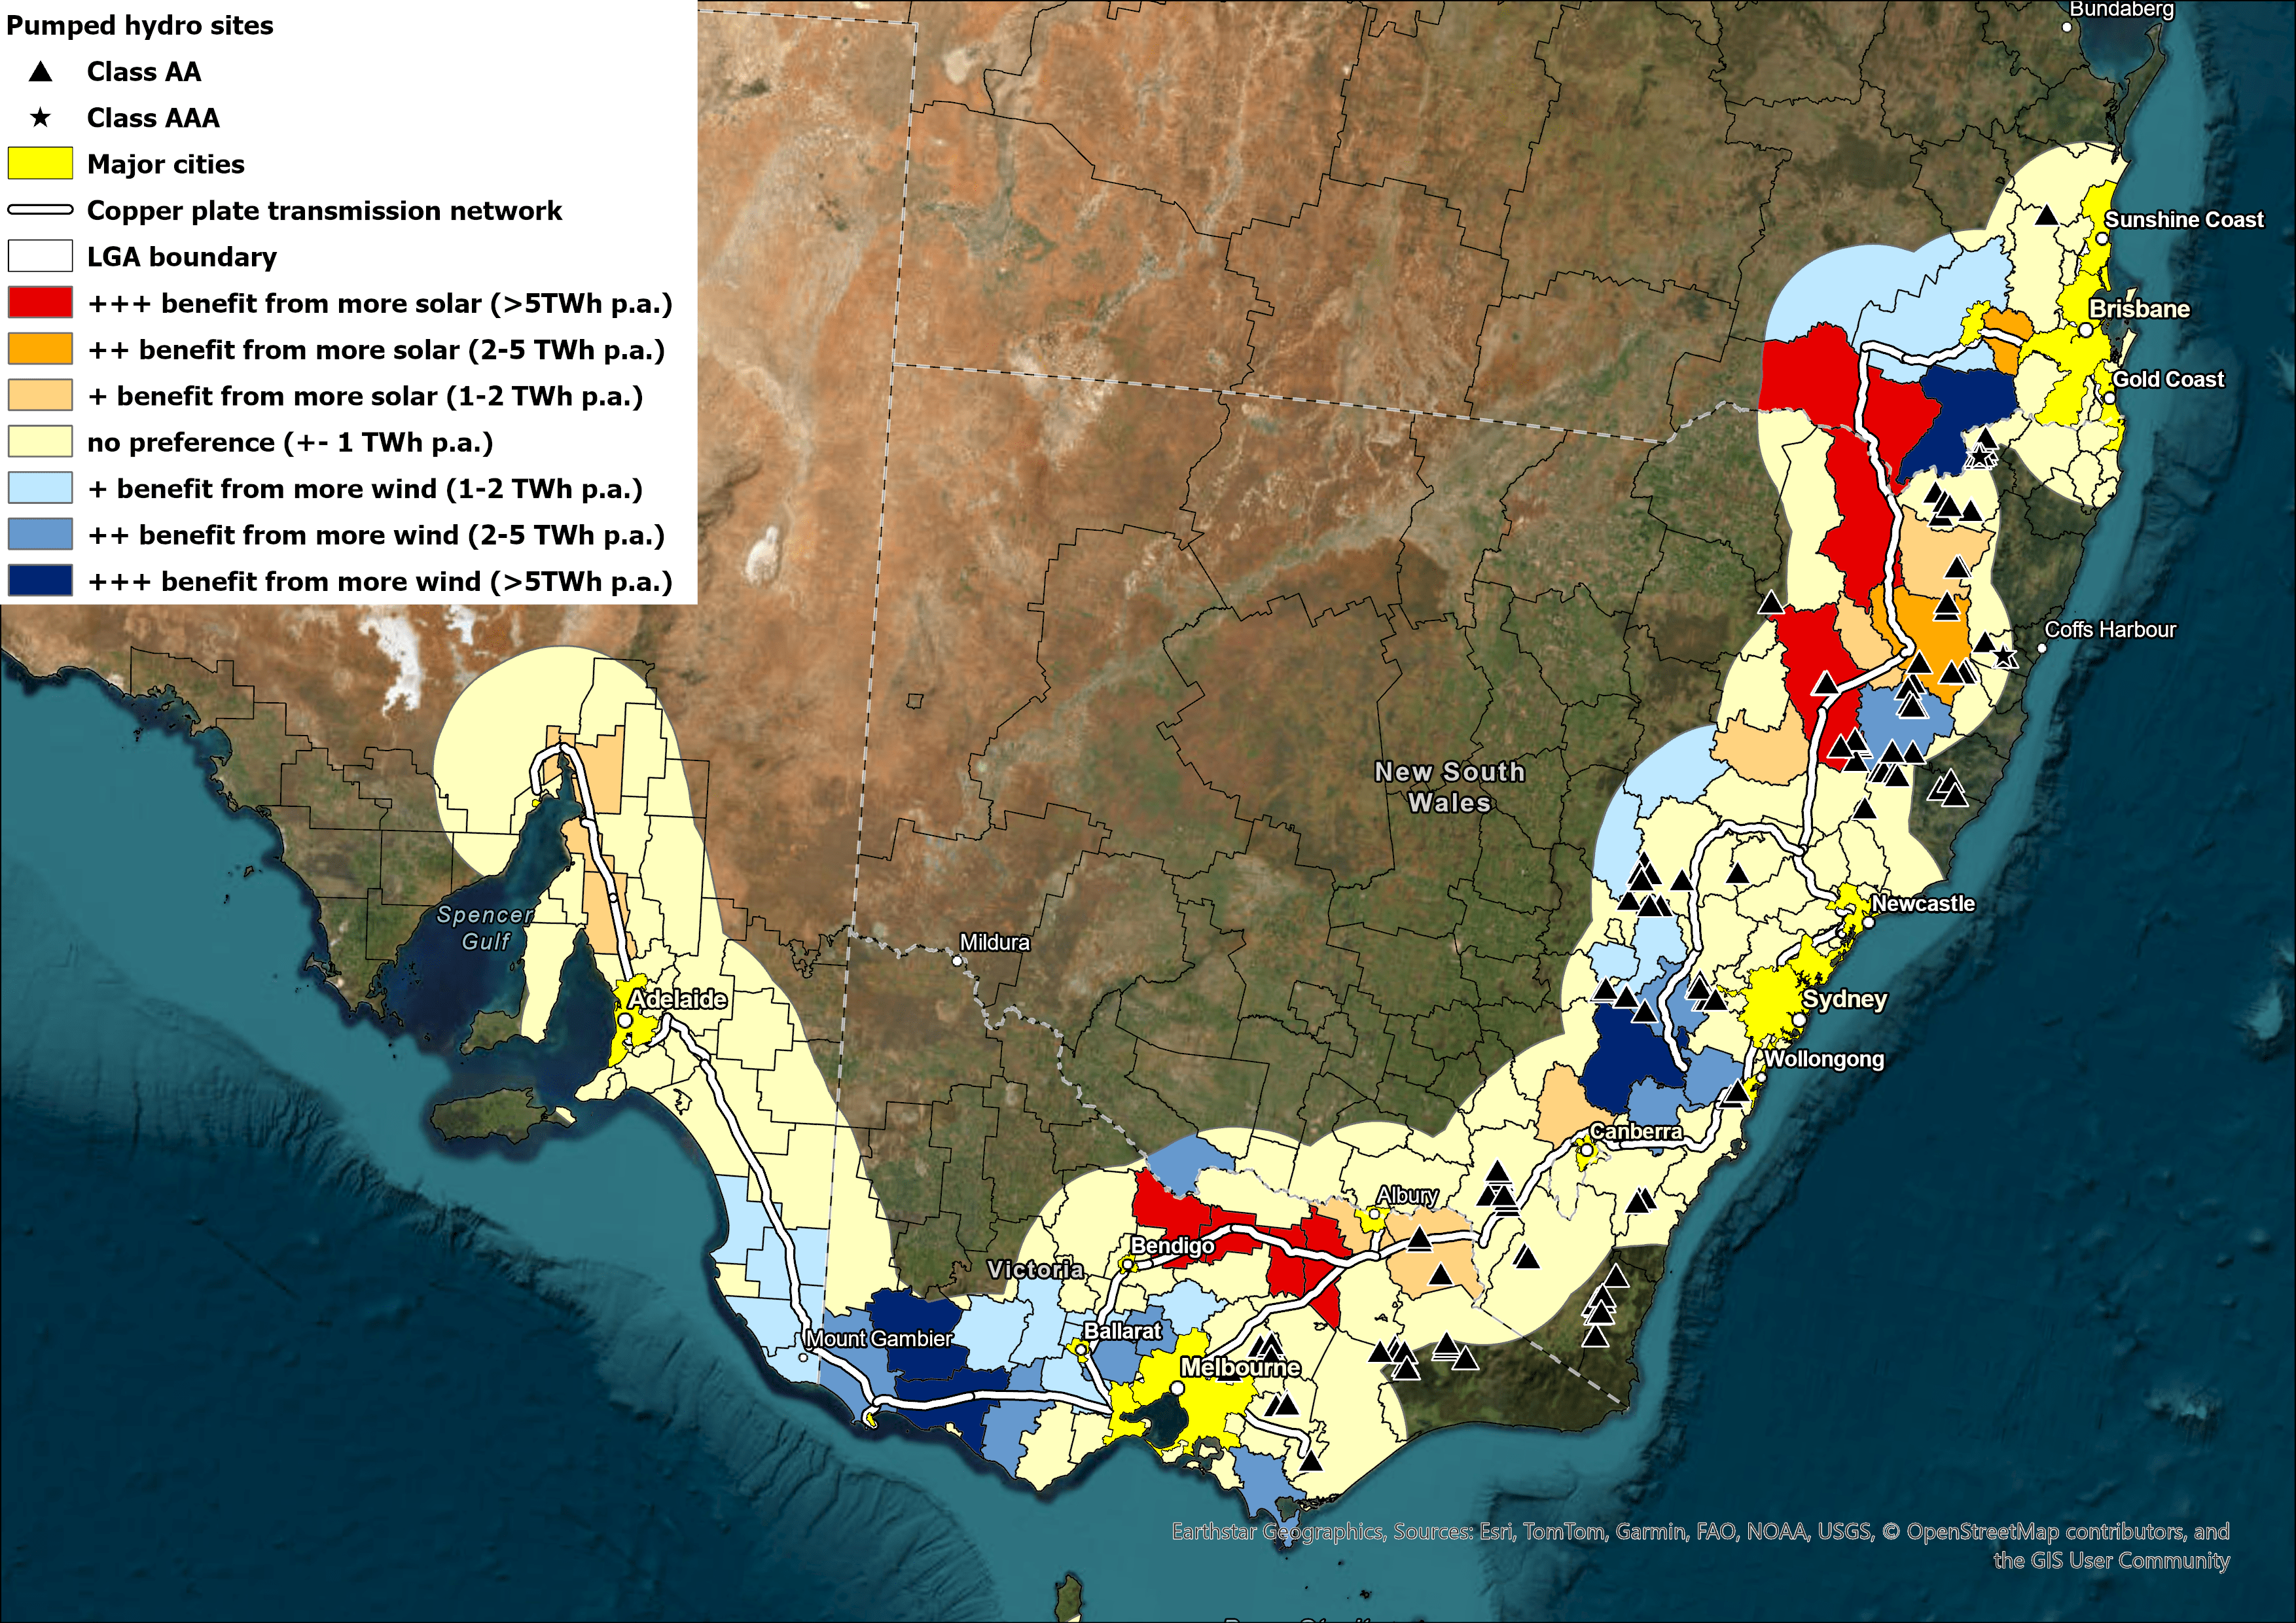
Figure 2: Darker red colours correspond to improved investment in the solar-dominated scenario, while darker blue colour corresponds to improved investment in the wind-dominated scenario.
How does this line up with Renewable Energy Zones?#
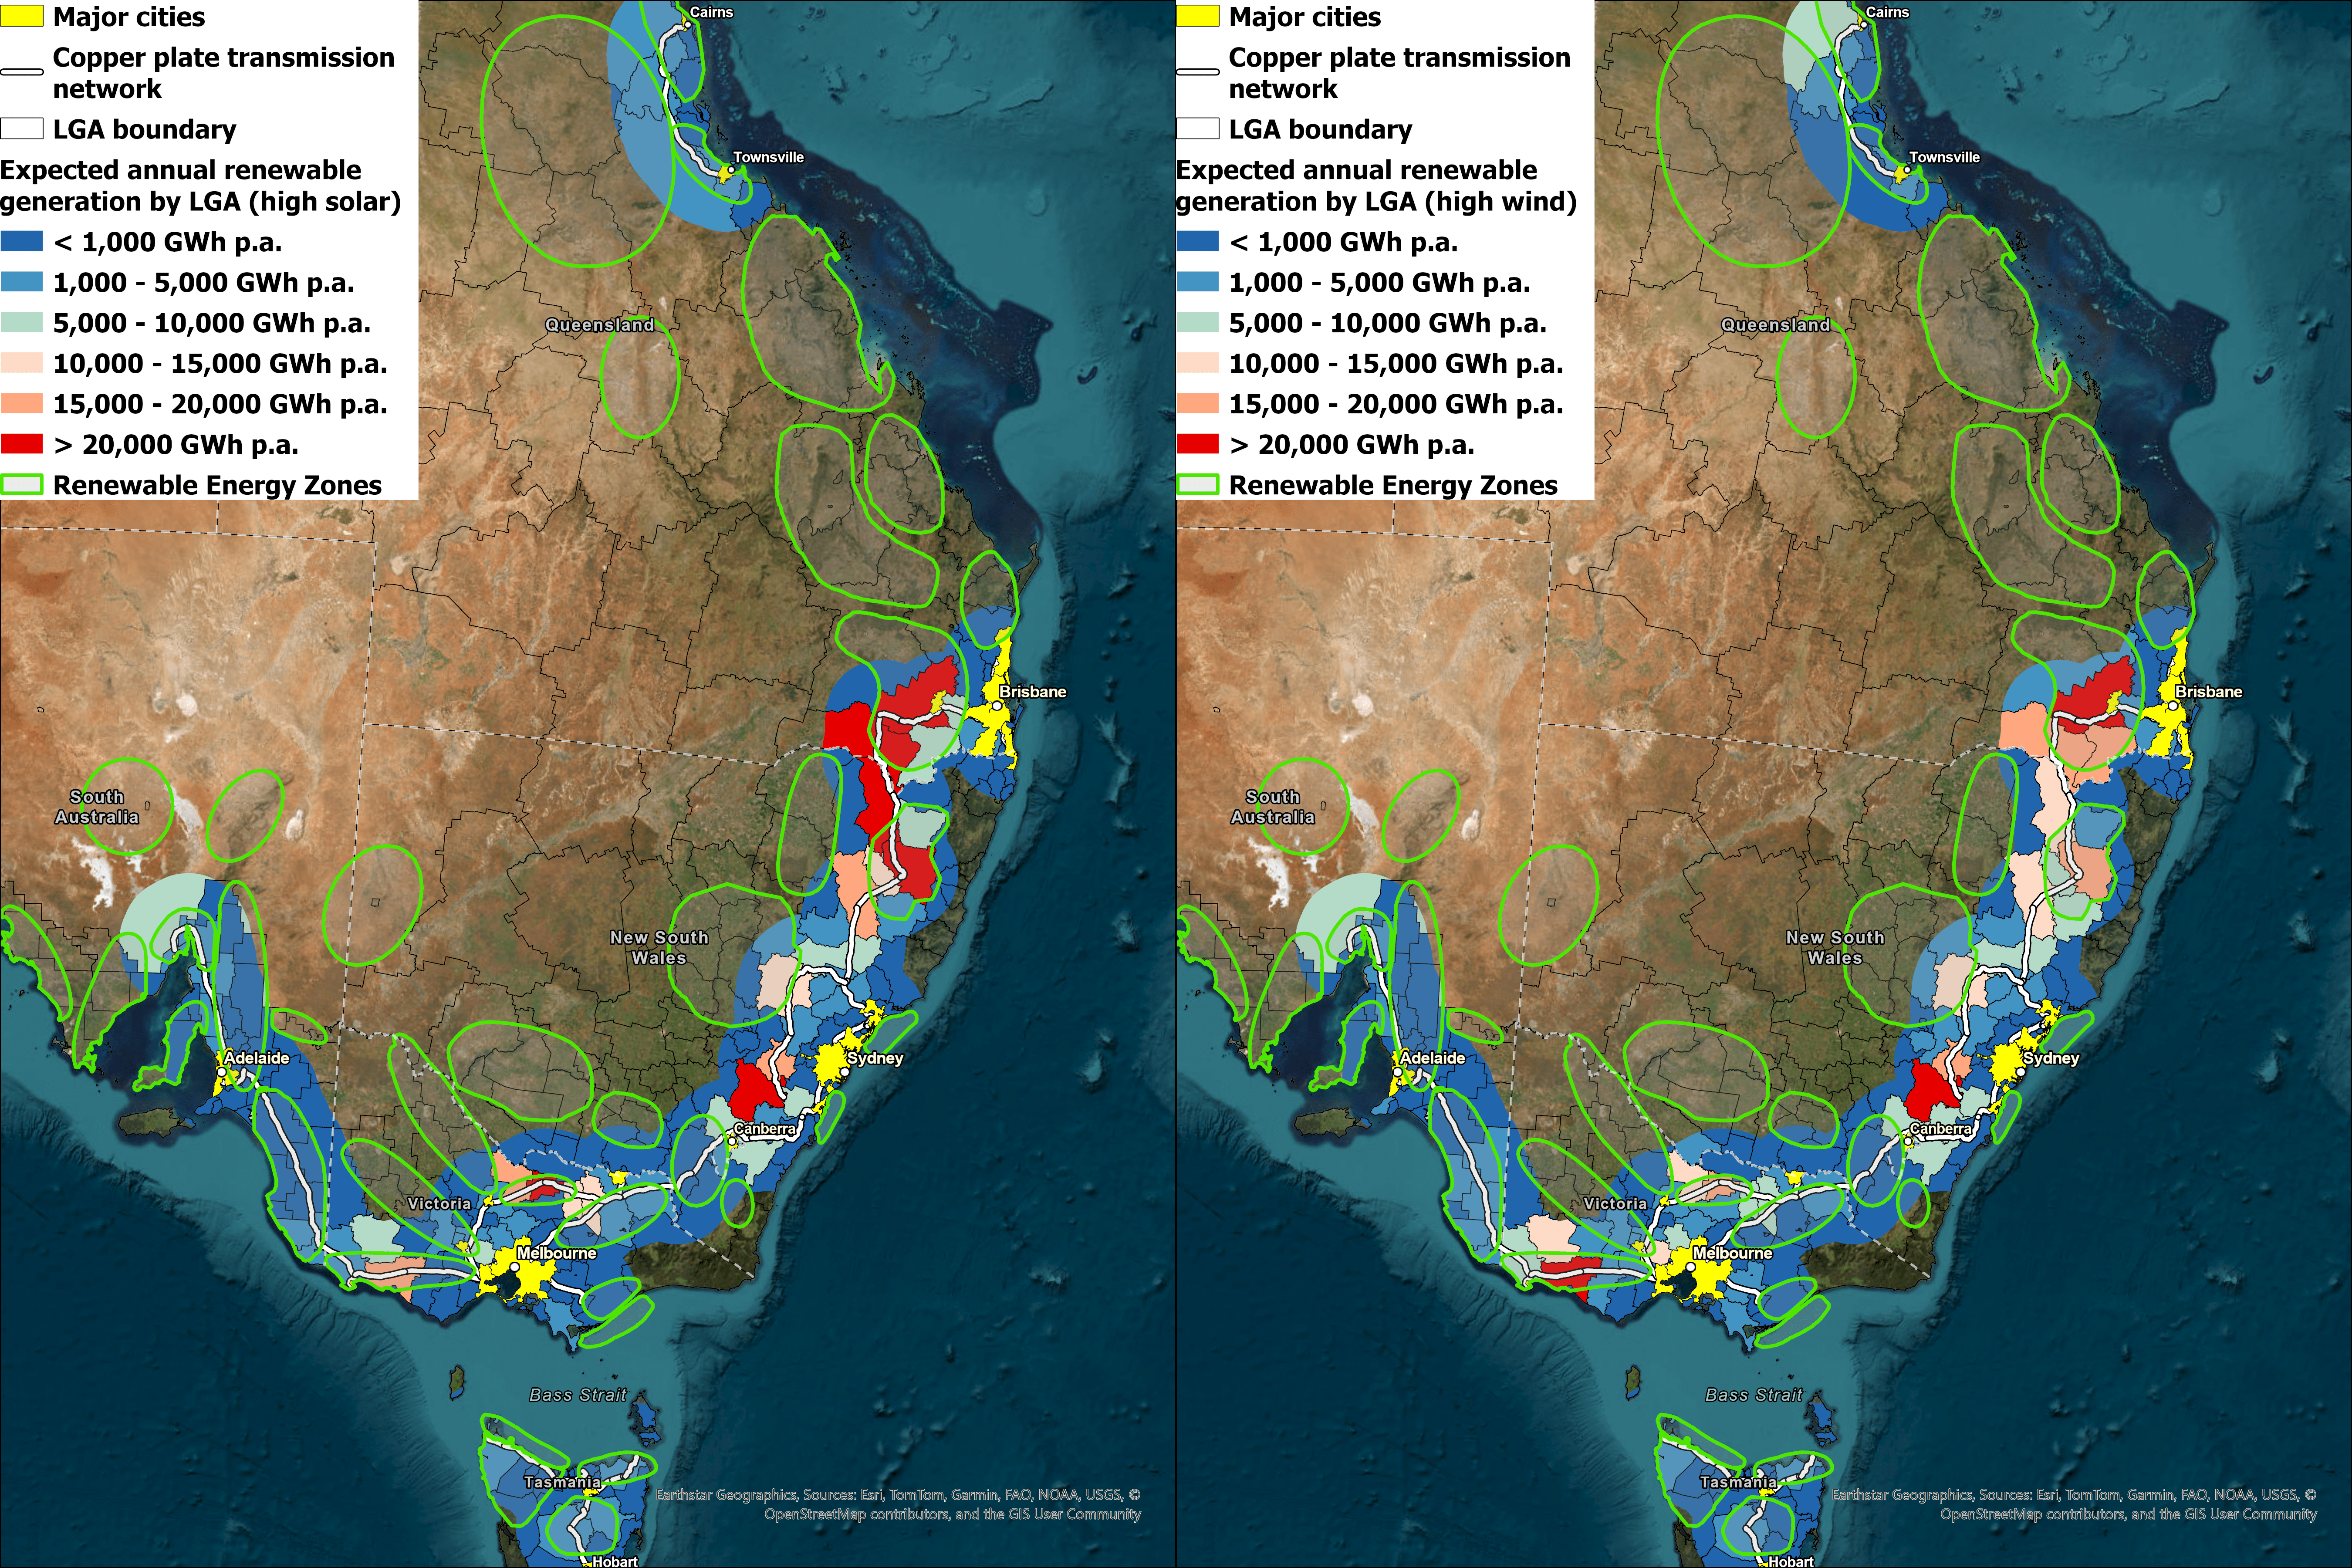
Figure 3: LGAs vs REZs.
State governments have already declared Renewable Energy Zones (REZs) in many of these areas. Our LGA‑level hotspots largely reinforce those choices but add political clarity. LGAs control planning permits, road upgrades and community engagement. Aligning state REZ plans with council‑level opportunity data can de‑risk projects and speed up grid connections.
One notable gap is several REZs between Townsville and Brisbane. Because we did not assume a continued transmission upgrade between the two regions in the modelling, those sites scored lower than the alternatives closer to either Townsville or Brisbane. If the state or federal government commits to greatly reinforcing that corridor, the picture could change quickly.
Billions on the table, and local jobs to match#
The renewable “hot‑spot” councils contain prime solar and wind real estate, which translates to long-term investment pipelines worth tens of billions of dollars. According to the numbers in the Draft GenCost 2024-25 and AEMO’s Transmission Cost Database (about $1.1 million per MW for solar, $2.5 million for wind, and roughly $4,900 per MW‑kilometre of new spur transmission lines), Toowoomba (~50 TWh in both scenarios) could attract around $34 billion in generation assets plus another $1–2 billion in short transmission links, while Inverell (26 TWh in high-solar and 14 TWh in high-wind scenario) could garner around $14 billion.
Investment in solar farms, wind farms, transmission and storage would be spread over the next 20 years.
That capital wave translates into serious job opportunities. Construction alone would create around 50 000 job‑years in Toowoomba and 20 000 in Inverell, based on industry‑standard labour factors. This translates to 2500 and 1000 permanent jobs respectively when spread over a 20 year construction cycle. After that, major refurbishment and replacement is required, with additional investment and on-going employment.
Additionally, ongoing operations and maintenance requires roughly 3,100 permanent positions backed by nearly $400 million a year in operating expenditure in Toowoomba and 1,200 jobs and $150 million annually in O&M in Inverell, with roles ranging from electrical technicians to vegetation management crews and local service providers.
Farmers who host solar farms, wind farms, transmission and storage, and their neighbours and communities, will benefit from large-scale long-term hosting fees.
Although spur lines to high-power transmission are only around five per cent of the bill, its route determines which LGAs see shovels in the ground first. LGAs that facilitate additional transmission can leverage very large investments in solar and wind farms.
LGAs that top the renewable heatmaps are well-positioned for substantial long-term economic gains, provided that they provide timely delivery of planning approvals and coordinated transmission upgrades.
LGAs that decline to participate will be bypassed by solar and wind farm developers, and benefits will instead go to neighbouring LGAs.
We have also done a similar analysis for electorates in Australia. Results are available via this link. More information is available in this RenewEconomy article and this podcast.